Note: As of the January 2026 Business Conditions Monthly (BCM) calculation, sufficient data have become available to resume publication of the three BCM diffusion indices. However, because the most recent fully complete run of constituent data dates back to July 2025, there is a discontinuity in the series. As a result, the current readings should be interpreted on a standalone basis — reflecting present conditions — rather than as the latest observation in a continuous trend. Until several additional months of consistent data are released and any revisions are incorporated, caution is warranted in drawing conclusions about momentum or directional changes in underlying economic conditions.
The Leading Indicator stands at 63, indicating a modestly positive tilt in forward-looking measures, with pockets of resilience in expectations-sensitive components. The Roughly Coincident Indicator registers at 42, suggesting somewhat subdued but not contracting real-time activity, consistent with a mixed and uneven current economic environment. Meanwhile, the Lagging Indicator comes in at 33, pointing to relatively soft backward-looking conditions, particularly in areas tied to credit and price dynamics.
LEADING INDICATOR (63)
The Leading Indicator registered 63, with seven of 12 components improving, one unchanged, and four declining.
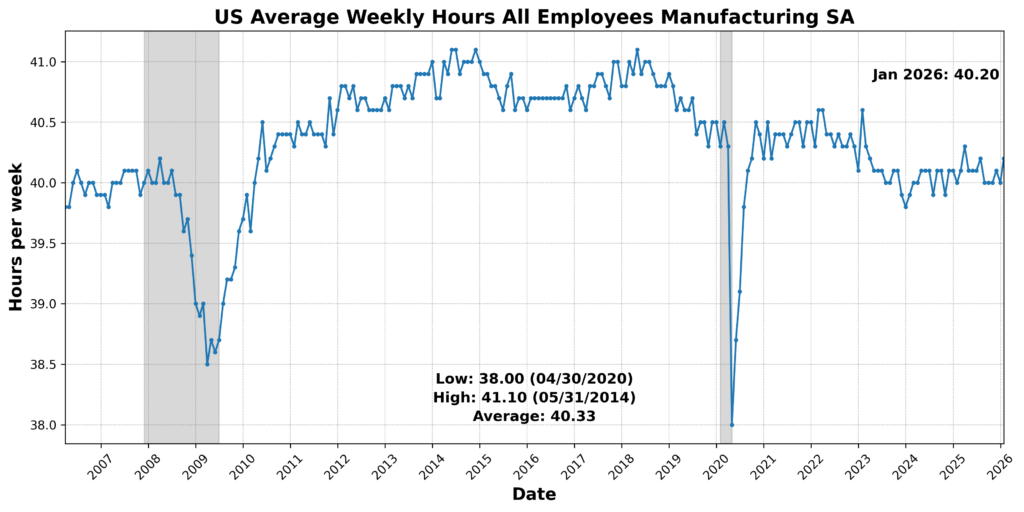
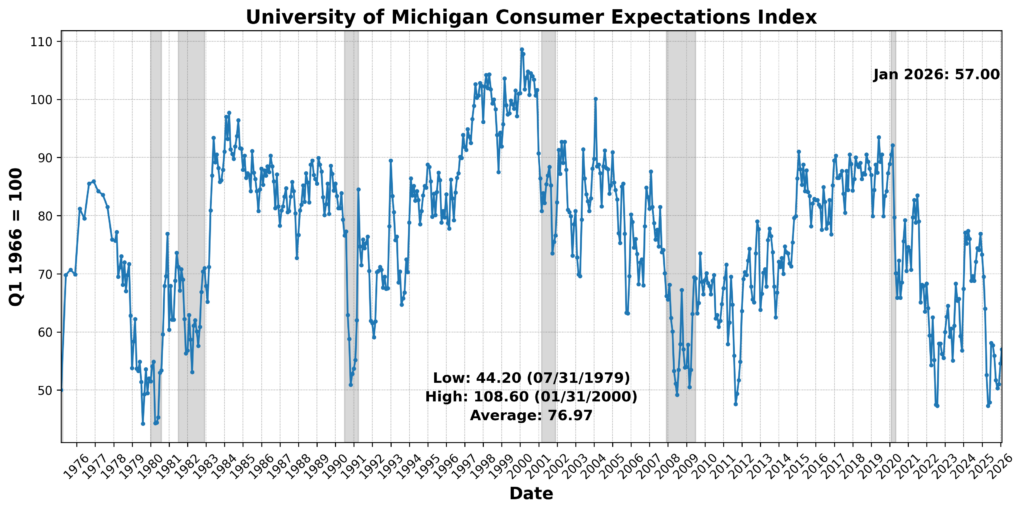
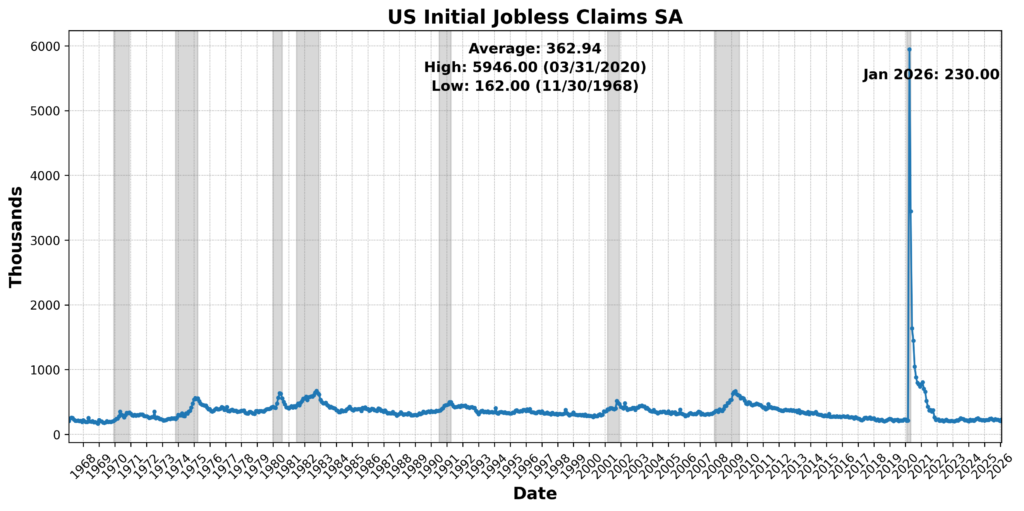
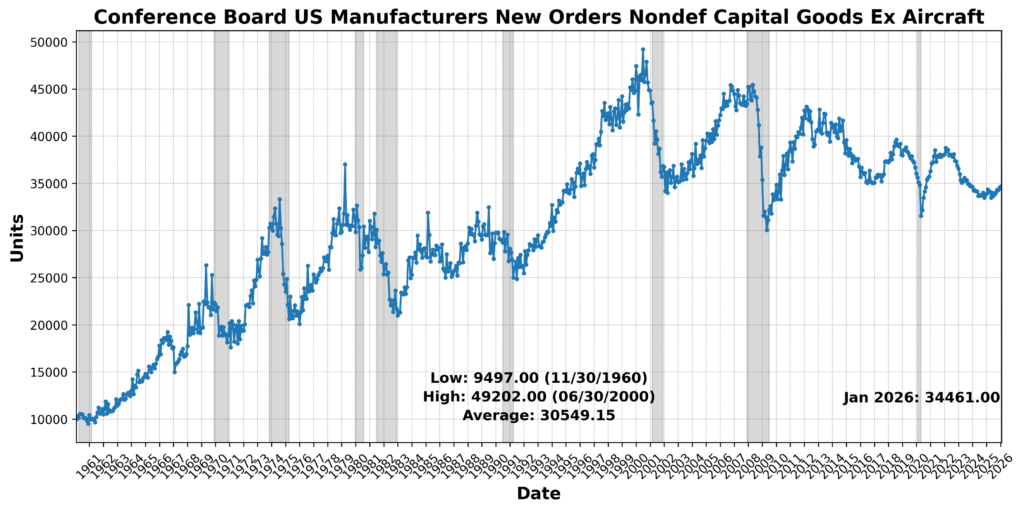
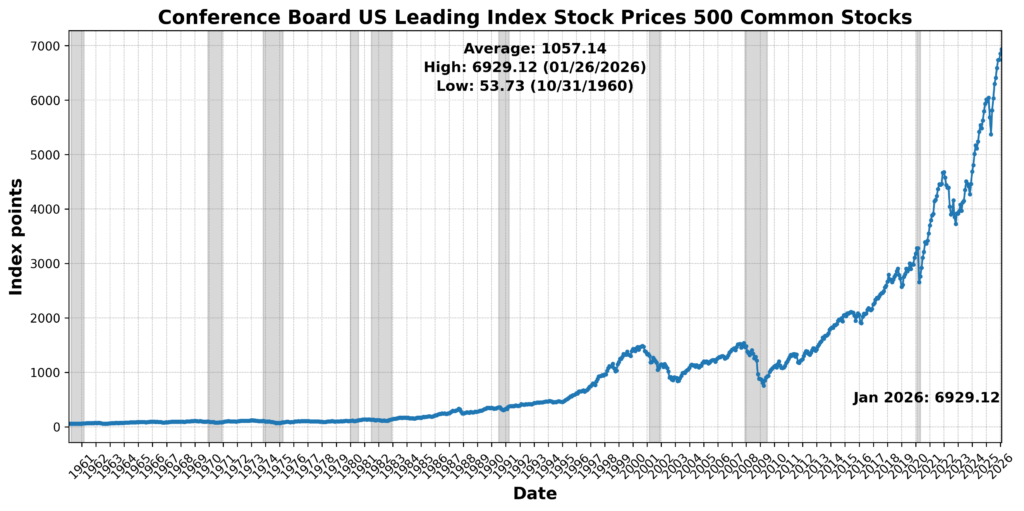
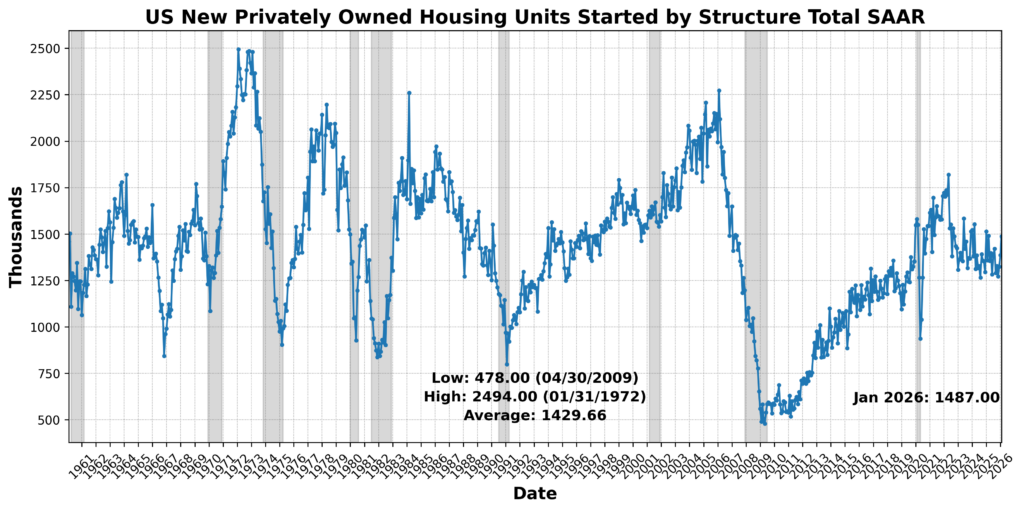
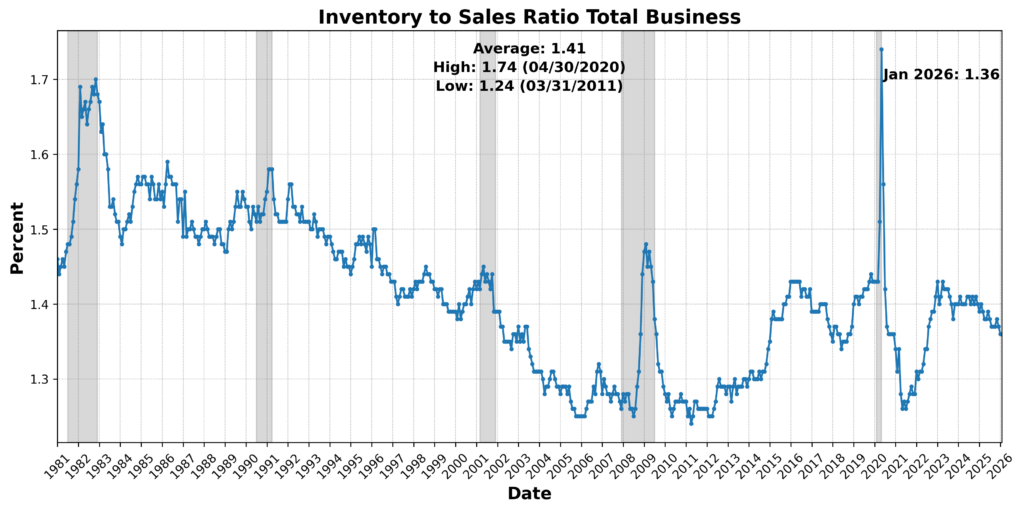
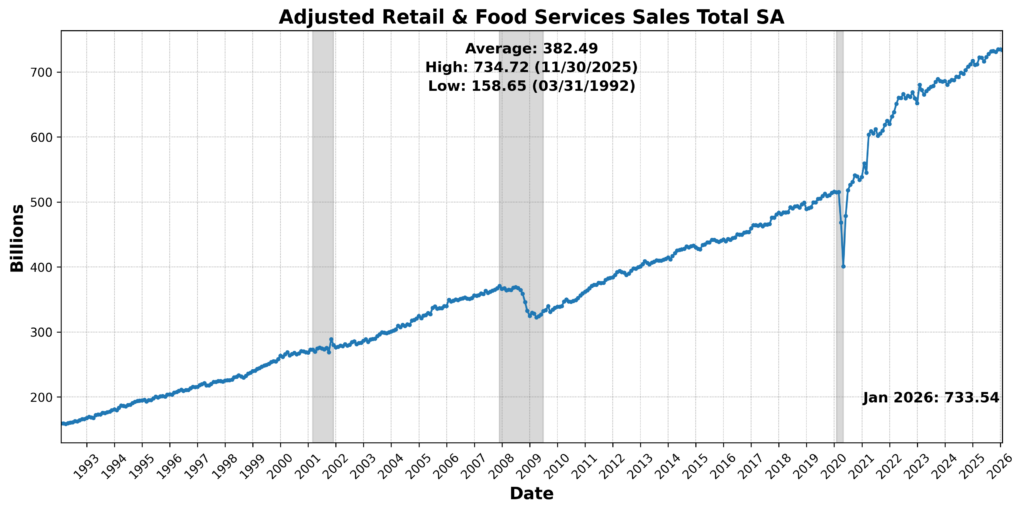
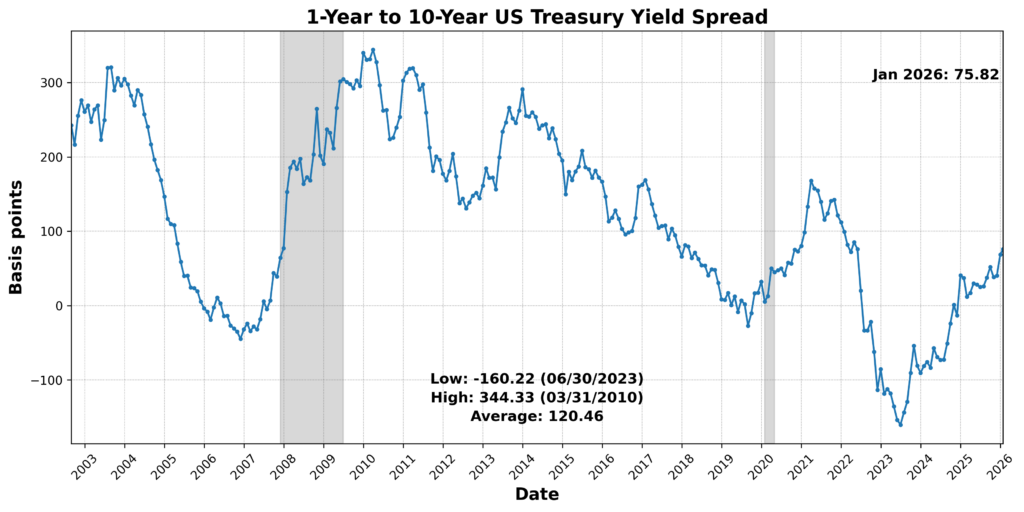
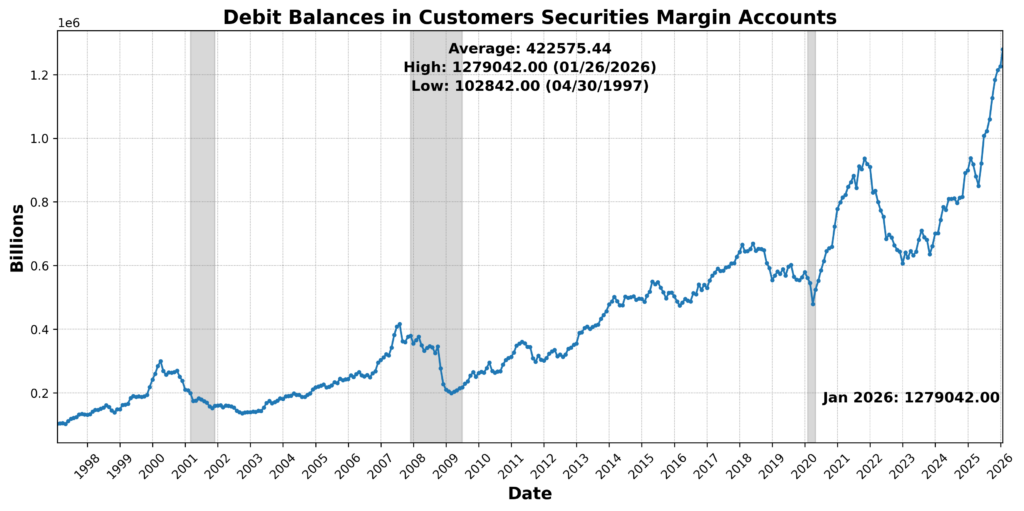
Gains were led by market-sensitive and forward-looking components. The University of Michigan Consumer Expectations Index rose 7.1 percent, while the Conference Board US Leading Index Stock Prices 500 Common Stocks increased 1.7 percent. The Conference Board US Manufacturers New Orders Nondefense Capital Goods Ex Aircraft advanced 0.5 percent, and US New Privately Owned Housing Units Started by Structure Total SAAR climbed 4.8 percent. United States Heavy Truck Sales SAAR surged 16.7 percent, and Debit Balances rose 0.9 percent. Labor-market forward conditions improved as US Initial Jobless Claims SA declined 6.0 percent (a positive after inversion). Offsetting these gains, the Inventory-to-Sales Ratio Total Business fell 0.7 percent, US Average Weekly Hours All Employees Manufacturing SA declined 0.2 percent, and the Conference Board US Leading Index Manufacturers’ New Orders Consumer Goods and Materials slipped 0.3 percent. The 1-to-10 Year Treasury Yield Spread widened sharply by 70.2 percent but was scored negatively given its inversion. Adjusted Retail and Food Services Sales Total SA was effectively unchanged. Overall, the leading profile reflects strength in expectations, housing, and financial conditions, partially offset by softness in production-related metrics and the yield curve signal.
ROUGHLY COINCIDENT INDICATOR (42)
The Roughly Coincident Indicator came in at 42, with two components improving, one unchanged, and three declining.
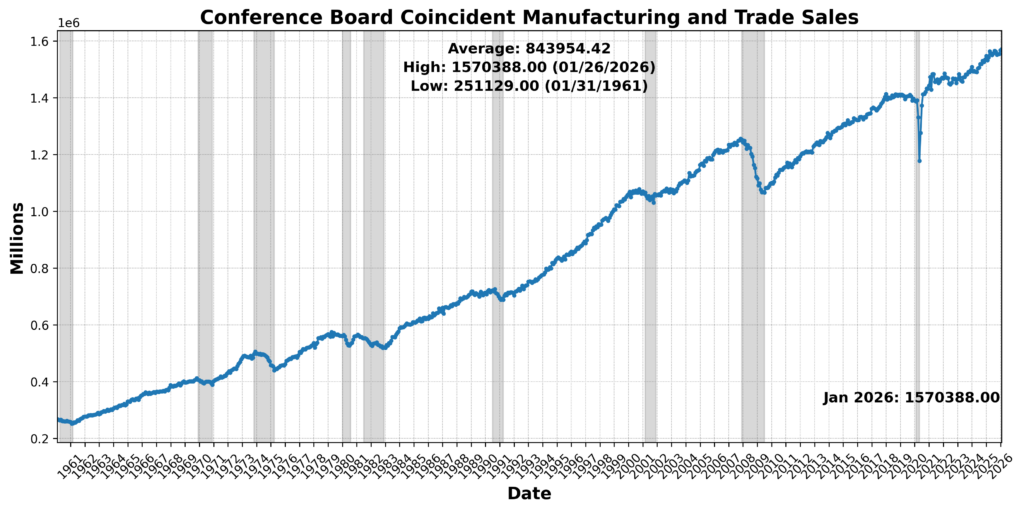
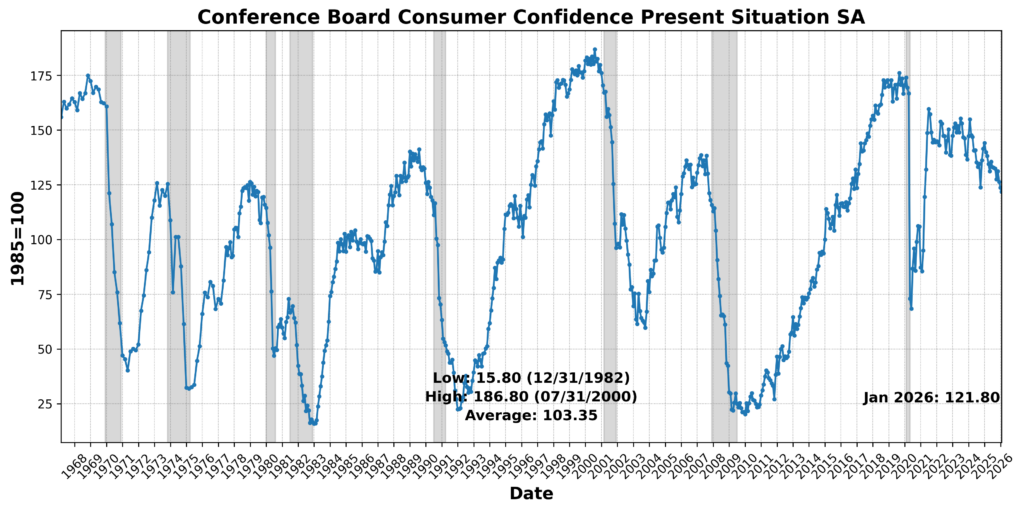
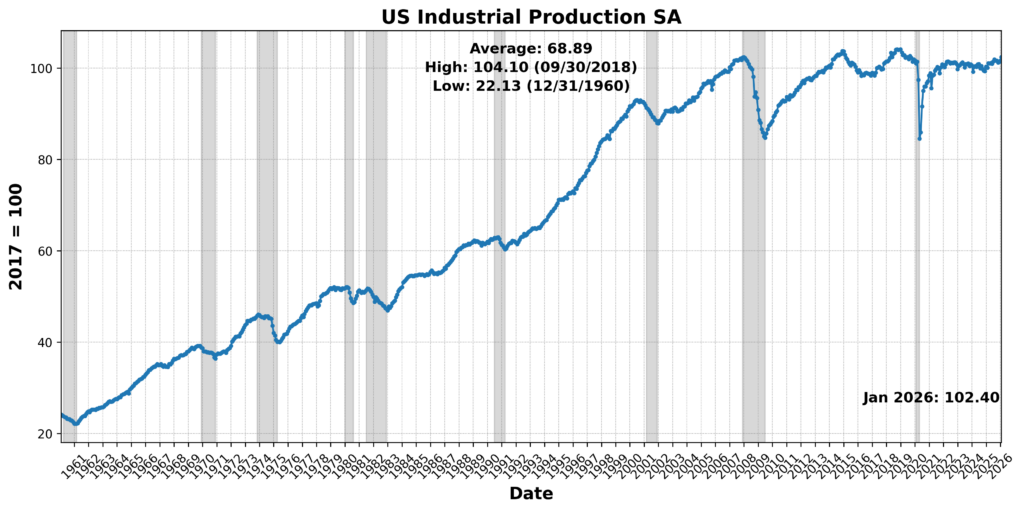
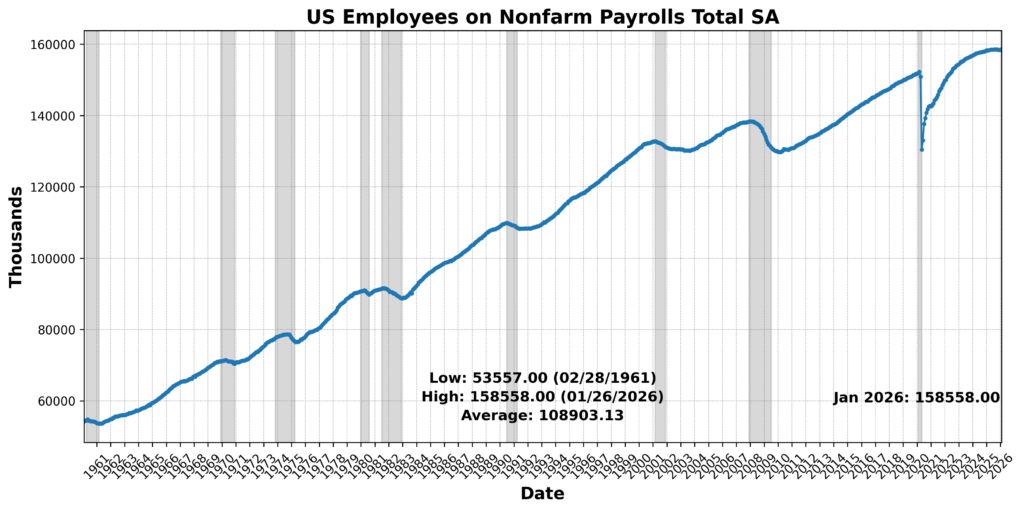
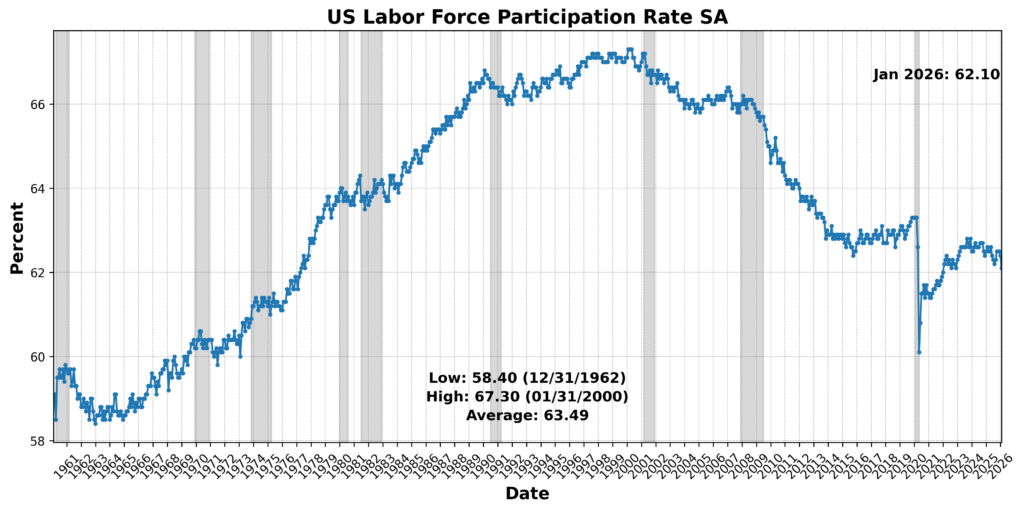
On the positive side, Conference Board Coincident Manufacturing and Trade Sales increased 0.8 percent, and US Industrial Production rose 0.3 percent. However, Conference Board Coincident Personal Income Less Transfer Payments declined 0.2 percent, and Conference Board Consumer Confidence Present Situation SA fell 2.1 percent. US Labor Force Participation Rate edged down 0.2 percent, while US Employees on Nonfarm Payrolls Total SA was essentially flat. The balance of evidence suggests modest activity in production and sales, but weakening income growth, participation, and sentiment are weighing on current conditions.
LAGGING INDICATOR (33)
The Lagging Indicator stood at 33, with two components improving and four declining.
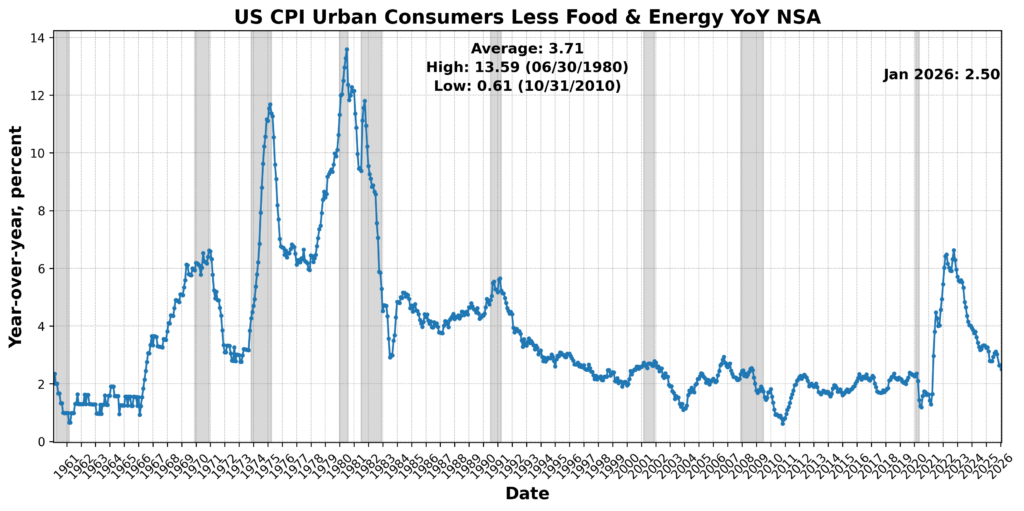
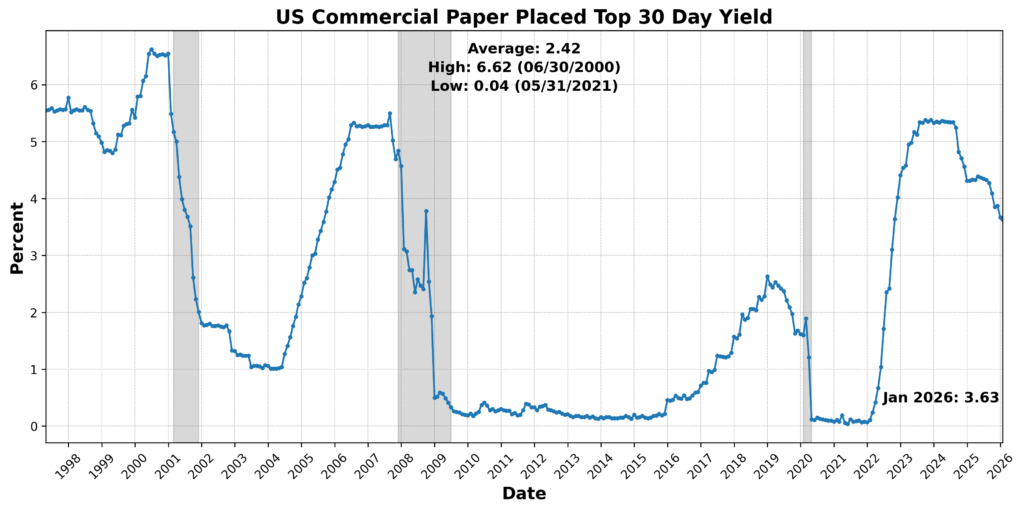
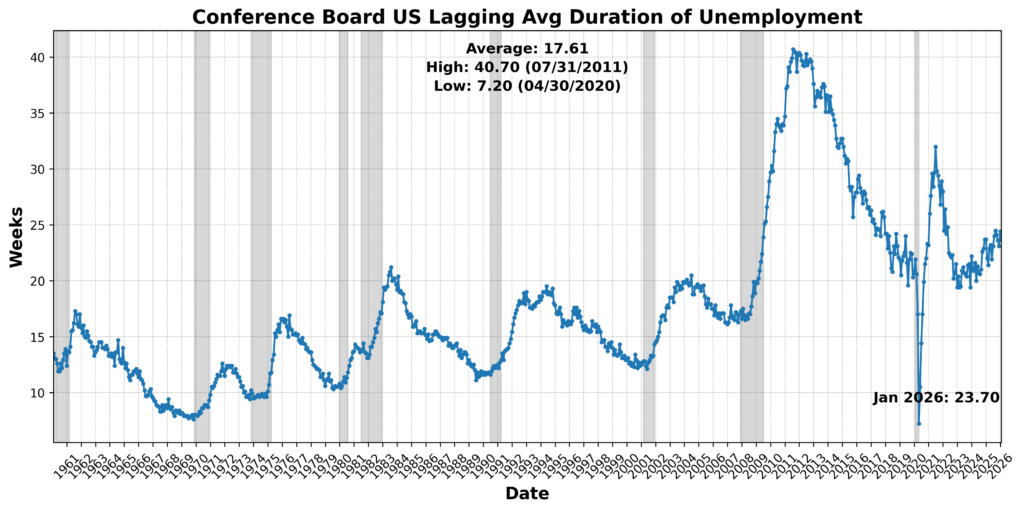
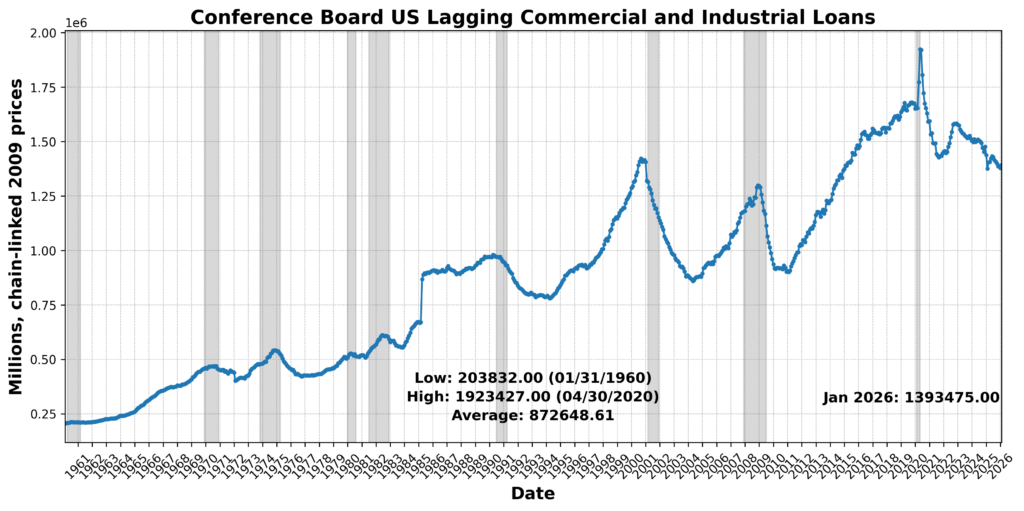
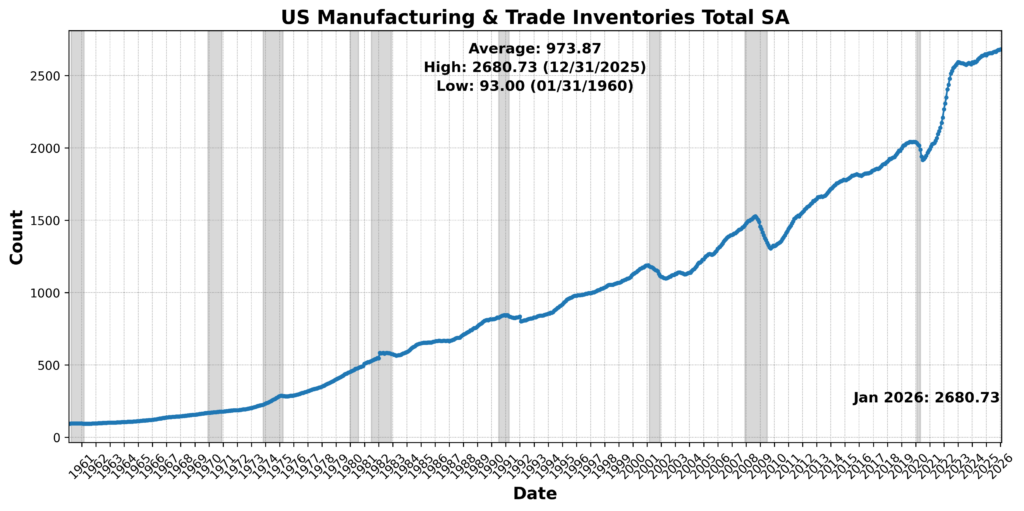
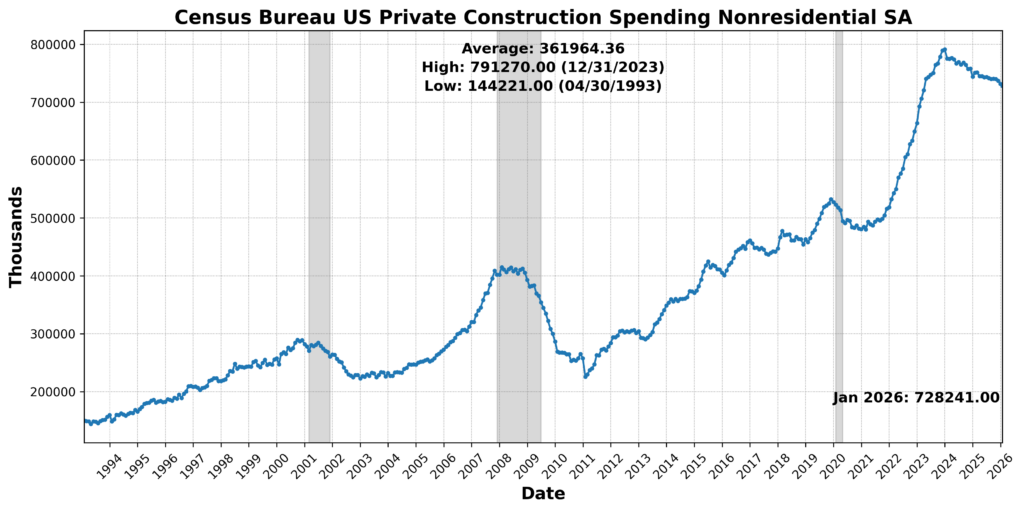
US CPI Urban Consumers Less Food and Energy Year over Year NSA rose 0.2 percent, and US Manufacturing and Trade Inventories Total SA increased 0.1 percent. In contrast, US Commercial Paper Placed Top 30 Day Yield declined 5.3 percent, Conference Board US Lagging Commercial and Industrial Loans fell 0.7 percent, and Census Bureau US Private Construction Spending Nonresidential NSA dropped 0.7 percent. The Conference Board US Lagging Average Duration of Unemployment rose 5.6 percent and was scored negatively after inversion. Taken together, the lagging profile points to persistent inflation alongside softening credit conditions, declining construction activity, and lengthening unemployment duration — signals consistent with a cooling economic backdrop.
The January 2026 BCM readings suggest an economy with a modestly positive forward tilt, uneven current activity, and still-soft trailing conditions, but with an important caveat given the break in the data. The Leading Indicator (63) points to resilience in expectations, housing, and market-sensitive components, indicating some forward momentum despite lingering weaknesses in production metrics and an adverse yield curve signal. In contrast, the Roughly Coincident Indicator (42) reflects a mixed present, where gains in production and sales are offset by declining income growth, sliding labor force participation, and soft consumer sentiment, leaving real-time activity subdued. The Lagging Indicator (33) reinforces a softer backdrop, with tightening credit conditions, weakening construction, and longer unemployment durations outweighing persistent inflation pressures. Taken as a whole, the configuration is consistent with tentative forward strength layered over fragile current conditions and weakening underlying fundamentals. But because these figures follow a several-month gap in complete data, they should be interpreted cautiously as a snapshot of current conditions rather than as evidence of a sustained trend or turning point.
DISCUSSION, February — March 2026
The latest inflation data present a conflicted but still informative picture, with early signs of disinflation at the consumer level offset by mounting upstream price pressures and a firmer underlying trend in services. February’s Consumer Price Index (CPI) came in softer than typical seasonal patterns would suggest, with headline inflation rising 0.27 percent month-over-month and holding at 2.4 percent year-over-year, while core CPI moderated to 0.22 percent. Much of the cooling reflects easing in heavily weighted categories such as rents and vehicles, and a broad decline in the share of items experiencing rapid price increases. Pockets of firmness remain, however, including apparel, discretionary services, and select goods categories influenced by rising input costs — particularly metals and memory chips — hinting at emerging supply-side pressures. At the same time, January’s Personal Consumption Expenditures (PCE) data showed a hotter underlying inflation trend, with core PCE rising 0.36 percent on the month and 3.1 percent year-over-year, driven largely by health care and other service categories. Consumer spending continues to rotate away from goods and toward services, even as income growth remains modest and the saving rate rises to 4.5 percent, suggesting cautious but still resilient household behavior.
Upstream, February’s Producer Price Index (PPI) reinforces the notion that cost pressures are building beneath the surface. Headline PPI rose a stronger-than-expected 0.7 percent on the month and accelerated to 3.4 percent year-over-year, reflecting higher transportation, warehousing, and especially metals costs — now up more than 15 percent since tariff measures took effect last year. While some components feeding into core PCE, such as health care and airfares, may exert less upward pressure in the near term, the broader trend in input costs points to continued pipeline inflation. Overlaying this dynamic is the emerging energy shock tied to the Iran conflict, which is likely to push headline CPI higher in the near term, potentially toward 3 percent, complicating the Federal Reserve’s policy path. Taken together, the data suggest that while consumer-level inflation has shown tentative signs of cooling, underlying service-sector strength and rising input costs — combined with geopolitical risks — leave the inflation outlook uncertain and increasingly sensitive to both supply shocks and policy responses.
Recent US labor market data point to a clear cooling in hiring, though the signal is muddied by temporary disruptions and measurement issues. February nonfarm payrolls fell by 92,000 — well below expectations — and the three-month average slowed to just 5,700 jobs, indicating that hiring momentum has nearly stalled and is likely running below breakeven. Some of the weakness reflects one-off factors, including a major health-care strike, adverse winter weather, and payback from unusually strong January conditions, while revisions to business formation estimates may have further amplified the decline. Even so, broader indicators suggest genuine softening: the unemployment rate rose to 4.44 percent, driven by job losers, while rising inflows into unemployment and declining outflows point to a less dynamic labor market. Wage growth remains relatively firm at 0.4 percent, but appears uneven and partly distorted by sector-specific effects, and aggregate income growth has softened as declining payrolls offset earnings gains.
At the same time, complementary data suggest the labor market is not collapsing but instead settling into a looser equilibrium. Job openings rose unexpectedly to 6.95 million in January, and private payroll data showed a modest gain of 63,000 jobs in February, with hiring concentrated in health care, education, and smaller firms. However, the ratio of vacancies to unemployed workers remains below one, indicating that slack persists and that labor demand is no longer outpacing supply. The quits rate has stabilized and layoffs have edged lower, reinforcing the view of reduced churn rather than renewed strength. Taken together, the data describe a labor market that is cooling and stabilizing at a lower level of activity — no longer a clear source of inflationary pressure, but not yet signaling a sharp deterioration — leaving policymakers inclined toward caution but still biased toward eventual easing.
The February ISM surveys paint a picture of continued expansion across both manufacturing and services, though with important differences in momentum and inflation signals. The ISM Manufacturing PMI edged down slightly to 52.4 but came in above expectations, indicating ongoing — if somewhat moderating — growth in the industrial sector. Demand remains solid, with new orders still firmly in expansion territory and supported by low customer inventories and improving backlogs, suggesting continued production ahead. The headline was bolstered by gains in employment, inventories, and slower supplier deliveries, the latter signaling capacity strain. However, a sharp rise in the prices-paid index — driven in part by higher metals costs and tariff-related pressures — points to renewed input cost inflation that may concern policymakers even as output stabilizes.
In contrast, the ISM Services PMI delivered a stronger and more broadly positive signal, jumping to 56.1, its highest level since mid-2022. The increase was driven by a surge in new orders, accelerating production, and improving employment, indicating robust demand across the dominant services sector. Backlogs and export orders also strengthened, while supply chains showed modest improvement. Importantly, price pressures became less pervasive, with the services prices index declining, offering some relief on the inflation front. Taken together, the two reports suggest a US economy entering the year with improving activity and sentiment, led by services strength and supported by steady manufacturing demand, but with a divergence in inflation dynamics — easing in services while intensifying in goods — that complicates the broader outlook.
Recent sentiment data across consumers and small businesses point to a cautiously stable but increasingly fragile outlook, with geopolitical and energy developments emerging as key risks. The University of Michigan’s preliminary consumer sentiment index slipped modestly to 55.5 in March, as a decline in expectations more than offset a slight improvement in current conditions, with the drop largely concentrated after the onset of military action in Iran. Inflation expectations remained relatively anchored — unchanged at 3.4 percent for one year and easing slightly to 3.2 percent over five years — but rising gasoline prices, up roughly 27 percent this month to their highest levels since late 2023, pose a growing threat to real incomes and future confidence. Small-business sentiment remains just above its long-run average, with the NFIB index at 98.8, supported by improved recent sales and profit trends, but forward-looking indicators have softened, including a notable drop in expected sales and only modest plans for capital spending. While fewer firms are currently raising prices, a significant share still intends to do so, reflecting persistent cost pressures. Across businesses, taxes remain the top concern, followed by labor quality, inflation, and weakening sales, with rising competition and financing concerns also in the mix. Taken together, the data suggest that while sentiment has not yet deteriorated sharply, it is increasingly vulnerable to energy-driven cost shocks and geopolitical uncertainty, which could weigh on both consumer demand and business confidence in the months ahead.
Retail sales data and the latest consumer surveys together suggest a consumption picture that is shifting from temporary softness toward more structural pressure. Retail sales dipped 0.2 percent in January, largely due to winter weather disruptions that curtailed in-person activity, especially dining out, while boosting online purchases, which helped cushion the decline. Core measures excluding autos and gasoline remained modestly positive, indicating that underlying demand had not collapsed and could rebound as weather effects fade. However, that near-term stabilization is now being challenged by a sharp energy-driven shock tied to the Iran conflict, with gasoline prices jumping from about $2.94 to $3.63 per gallon and oil rising roughly 40 percent. This surge has rapidly fed into consumer expectations, with anticipated gas price increases and broader inflation expectations moving higher, while perceptions of personal finances have deteriorated meaningfully.
More concerning for the consumption outlook is the breadth of this shift in sentiment. Higher-income households — previously a key driver of spending strength — have also pulled back sharply, raising the risk that aggregate consumption may weaken more broadly. At the same time, rising fuel costs are acting as a direct drag on discretionary spending, effectively reallocating household budgets toward necessities while amplifying price pressures in areas like transportation and travel. Coupled with growing concerns about job security and declining confidence in future income, these developments suggest that while early-year retail weakness may have been partly weather-related, the outlook for consumer spending is increasingly constrained by a combination of eroding purchasing power and heightened uncertainty.
Productivity and industrial output data together point to an economy that is still generating growth efficiently, even as sectoral performance remains uneven. Labor productivity rose at a solid 2.8 percent annualized pace in the fourth quarter, with prior quarters revised higher due to lower measured hours worked, reinforcing a favorable underlying trend. While unit labor costs increased at a 2.8 percent annualized rate in the quarter — driven by stronger compensation — the four-quarter trend remains subdued at just 1.3 percent, indicating that labor costs are not exerting meaningful inflationary pressure. This combination — steady productivity gains alongside contained cost growth — suggests that output can continue to expand without forcing a policy response from the Federal Reserve on labor-driven inflation grounds.
Industrial production data echo this theme of modest but uneven expansion. Output rose 0.2 percent in February, supported by gains in manufacturing — particularly transportation equipment and business investment-related categories — while consumer goods production was flat, with durable gains offset by declines in nondurables. Utilities dragged on the headline amid weak natural gas output, while mining and energy extraction showed early signs of strengthening, likely to become more important given geopolitical supply disruptions. Taken together, the data suggest a production environment characterized by resilience in capital-intensive and strategic sectors, softer performance in consumer-facing goods, and an overall growth path that remains intact but far from broad-based.
The early March Beige Book points to an economy that is losing some momentum but largely maintaining its footing, with activity expanding at a slight to moderate pace in seven of twelve Federal Reserve districts, down from eight previously, and a growing share reporting flat or declining conditions. Consumer behavior remains uneven, with heightened price sensitivity among lower-income households weighing on discretionary spending, including weaker auto sales. At the same time, manufacturing conditions improved, supported in part by demand tied to data centers and energy infrastructure, highlighting a divergence between capital-intensive sectors and more consumer-facing areas. Employment was broadly stable, though firms cited softer demand, rising input costs, and uncertainty as constraints on hiring. Price pressures remained moderate, with tariffs contributing to elevated costs across most districts, but firms expressed expectations for some easing ahead — an encouraging signal that is now complicated by renewed geopolitical risks. While business sentiment has become more optimistic, the report largely predates the escalation of the Iran conflict and related policy uncertainty, suggesting that current conditions may understate the degree of volatility and downside risk facing the economy in the near term.
The current policy mix reflects a growing tension between a still-restrictive monetary stance and a fiscal impulse that is increasingly being offset by external shocks. At its March meeting, the Federal Reserve held rates steady at 3.50 percent to 3.75 percent but signaled a more hawkish underlying posture, raising its estimates of long-run growth and the neutral rate — partly on expectations of AI-driven productivity gains — while also revising inflation forecasts higher. Although the median projection still includes one rate cut this year, the upward shift in the dot plot and higher assumed policy baseline suggest a reduced willingness to ease quickly, especially amid lingering inflation risks and geopolitical uncertainty. This leaves policy effectively tighter than it may appear on the surface, particularly as the Fed balances stronger projected growth against rising inflation pressures and an unsettled global backdrop.
At the same time, the anticipated boost from fiscal policy is being eroded in real time. The One Big Beautiful Bill Act was expected to support consumption through increased tax refunds — roughly $650 to $800 per household, contributing about 0.4 percentage points to GDP — but that impulse is now being offset by a sharp rise in energy prices tied to the Iran conflict. With oil prices already above the estimated breakeven level of roughly $83 per barrel, higher gasoline costs are effectively neutralizing the benefit of those refunds, particularly for lower-income households that spend a larger share of income on fuel. In effect, the policy mix is shifting from one of modest support to one of partial offset, where fiscal stimulus is diluted by energy-driven real income losses and monetary policy remains cautious. Together, this creates a more constrained near-term outlook, in which growth depends increasingly on higher-income consumers and favorable financial conditions, both of which are vulnerable to ongoing geopolitical and market volatility.
The US economy is showing modest but uneven growth, with services and productivity providing support while manufacturing, consumption, and hiring lose some momentum. Inflation appears to be cooling at the consumer level, but rising input costs and an energy shock tied to the Iran conflict are reintroducing upward pressure and complicating the outlook. The labor market is clearly softening, while consumer spending faces increasing strain from higher gasoline prices, weakening sentiment, and a potential pullback among higher-income households. Looking ahead, an increasingly cautious Federal Reserve (possibly facing a policy trap) and fiscal boost increasingly offset by energy costs leave the expansion intact but fragile, with growth more vulnerable to geopolitical risks and shifts in confidence.
LEADING INDICATORS

ROUGHLY COINCIDENT INDICATORS
LAGGING INDICATORS
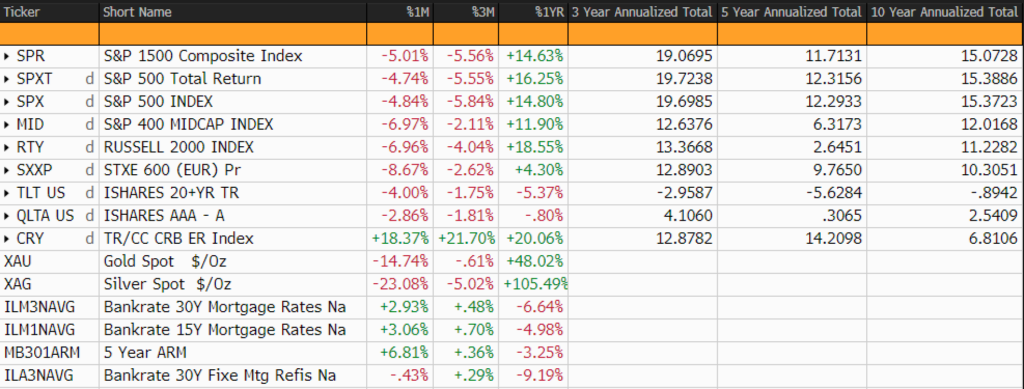
CAPITAL MARKETS PERFORMANCE