
This paper investigates the effect of affordable housing obligations in New Jersey on cost of living, cost of housing, and actual housing production. New Jersey’s Mount Laurel court cases established a doctrine whereby municipalities must permit their “fair share” of affordably priced housing. At various points since then, the legislature has interpreted this doctrine with specific, quantitative targets for municipalities to reach, or it has declined to do so, leaving enforcement up to the courts, which in turn backed away for several years from enforcing affordable housing targets. These policy changes provide an opportunity to investigate whether affordable housing targets are having their intended effect. Based on synthetic control analysis, the results show no effect of affordable housing mandates on housing production and minimal to no effect of affordable housing mandates on housing costs.
1. Introduction
The Mount Laurel court cases in New Jersey established that “a developing municipality may not, by a system of land use regulation, make it physically and economically impossible to provide low and moderate income housing.”[1]
While the initial ruling merely held that municipal land-use regulations could not exclude everything other than large-lot single-family houses, the legislature has interpreted the Mount Laurel doctrine to say that municipalities have an affirmative obligation to construct deed-restricted affordable housing. Until 1985, the legislature did not act. Municipalities had widely flouted or challenged the 1975 New Jersey Supreme Court decision, leading to a “mass of protracted litigation.”[2] In 1983, the Mount Laurel II decision affirmed a “builder’s remedy” against municipalities that failed to meet judicially determined affordable housing targets, thereby incentivizing the legislature finally to act.[3]
The result was the Fair Housing Act of 1985, which established an independent body tasked with calculating each municipality’s “fair share” allotment of new affordable housing units, which would afford them safe harbor from builder’s remedy lawsuits. That body, the Council on Affordable Housing (COAH), issued its first round of fair share calculations in 1987, and they remained in force until 1993. Round II of COAH’s fair-share obligations were in force from 1993 to 1999, and after 1999 COAH went effectively defunct after its Round III calculations were invalidated by the courts. It was finally abolished in 2024 in favor of a new method of calculating fair-share obligations. Since 2007, then, when COAH’s Round III rules were invalidated, New Jersey municipalities have had to revert to the former method of judicial certification of compliance with the Mount Laurel doctrine.
How have the Mount Laurel doctrine and its varied interpretations by the legislature affected housing production and costs in New Jersey? To answer this question, we first need to understand the political economy of affordable-housing targets and inclusionary zoning programs.
2. The Effects of Affordable-Housing Mandates
In order to comply with COAH rules, New Jersey municipalities adopted inclusionary zoning. Inclusionary zoning comes in two forms: mandatory and voluntary. Mandatory inclusionary zoning requires that any new development of a specified size or kind set aside a percentage of units that must be rented or sold at an affordable price to low- or moderate-income consumers. Deed restrictions and income verification enforce the affordability requirement. Voluntary inclusionary zoning offers a developer a regulatory benefit, such as an increase in allowed density, provided a certain percentage of units are rented or sold at below-market rates in the same manner.
The Fair Housing Act of New Jersey requires municipalities to develop at minimum a voluntary inclusionary zoning program, but mandatory programs are ubiquitous throughout the state, according to a database maintained at inclusionaryhousing.org.
Inclusionary zoning only functions if the market-rate units in an inclusionary development are expensive. The developer has to make a large profit on those units to offset the losses on the units that are required to be sold or rented at below-market rates. If housing in general becomes affordable, then, inclusionary zoning does not work.
Inclusionary zoning has other curious effects. As a form of price control, it creates shortages and rationing. More people want the below-market units than are available, so they have to be allocated by lottery. Moreover, inclusionary zoning, at least in the mandatory form, reduces the supply of housing, because developers know they will make less profit from building than they would if there were no inclusionary requirements.
Empirical research largely confirms these theoretical expectations. Research in the Baltimore-Washington area finds that mandatory inclusionary zoning increases the cost of market-rate housing, though it might not affect new housing supply (Hamilton, 2021). An earlier study of California found that inclusionary zoning policies decreased the size and increased the price of single-family houses (Bento, et al., 2009). A study of San Francisco and Boston found that mandatory inclusionary zoning increased prices and reduced production in Boston while increasing prices during periods of rising prices and reducing prices during periods of falling prices in San Francisco, and not affecting production there (Schuetz, et al., 2011). Yet another study of California found strong adverse effects on production and prices (Means & Stringham, 2012). There’s only one contrarian study on the issue, finding that reduction in inclusionary zoning requirements in parts of California did not affect house prices (Hollingshead, 2015). It could be that these programs create hysteresis in housing markets once they’re implemented.
While these studies focus on mandatory inclusionary zoning, there are reasons to think that even voluntary inclusionary zoning, which is much more widespread, could have adverse consequences for housing production, particularly in a state like New Jersey or Massachusetts with a “builder’s remedy” available when municipalities fail to meet affordable housing targets.
Suppose that municipal leadership generally opposes new multifamily development. If a developer proposes a new market-rate multifamily development, it generally does not directly help the municipality meet its affordable housing target, because the units are usually not priced affordably enough. Moreover, since housing markets are supra-municipal, corresponding largely to commuting areas, municipal leaders may well realize that building market-rate housing has only weak effects on the overall affordability of housing within municipal boundaries, contributing rather to the affordability of housing throughout the local labor market. Realizing that they must meet their affordable housing targets, but disfavoring multifamily development generally, municipal leadership will have a clear incentive to deny planning permission for market-rate multifamily developments.
Anecdotally, the market-rate nature of a development (i.e., the lack of deed-restricted affordable units) frequently comes up as a justification for planning denials. State law doesn’t expressly protect municipal decisions to deny planning approval to market-rate multifamily projects, but municipalities generally enjoy broad discretion to deny approval for larger multifamily projects, through either site plan review, variance, or conditional use permit processes. When a lack of deed-restricted affordable units is combined with other features that may justify a denial, such as traffic impacts, a municipal land-use board may feel themselves on firmer ground to issue a denial than otherwise.
Anecdotally, the market-rate nature of a development (i.e., the lack of deed-restricted affordable units) frequently comes up as a justification for planning denials. State law doesn’t expressly protect municipal decisions to deny planning approval to market-rate multifamily projects, but municipalities generally enjoy broad discretion to deny approval for larger multifamily projects, through either site plan review, variance, or conditional use permit processes. When a lack of deed-restricted affordable units is combined with other features that may justify a denial, such as traffic impacts, a municipal land-use board may feel themselves on firmer ground to issue a denial than otherwise.
In this way, a state-level requirement that municipalities meet affordable-housing production targets will tend to reduce overall housing production and thereby increase overall housing costs.
Have affordable-housing production targets and inclusionary zoning had these effects in New Jersey? We need a credible empirical test comparing New Jersey to similar states.
3. Empirical Analysis
The empirical strategy here is to compare the rounds of binding affordable-housing obligations in New Jersey to the same periods in other states and to periods in New Jersey when there were not binding affordable-housing obligations. Of particular interest are two outcomes: building permits per capita (the best measure of housing production) and two measures of cost of living in general and cost of for-sale houses in particular. There is only one annual measure of state-level cost of living that goes back before 2008 (Berry, et al., 2000). We do not have annual data on rental costs, but the FHA produces an all-transactions house price index based on resales and appraisals. Their quarterly data are averaged by year to create an annual index.
The outcome variables are as follows: 1) total housing units permitted per capita, from the U.S. Census Bureau, 2) housing units in five-or-more-unit buildings per capita (these housing units are most likely to be affordably priced), 3) annual change in state cost of living, and 4) annual change in the state’s all-transactions house price index. The annual state-level building permits data go back to 1980 and up to 2023. The cost of living data go back to 1960 and up to 2007. House price data go from 1975 to 2024.
Figure 1 shows how total building permits per capita have evolved in New Jersey and two neighboring states since 1980. The vertical lines set off the period of 1985 to 1999, when Mount Laurel obligations were most seriously enforced, and the period 1999 to 2007, when Mount Laurel obligations were barely enforced at all, because the courts were waiting on a legislative solution that never came.
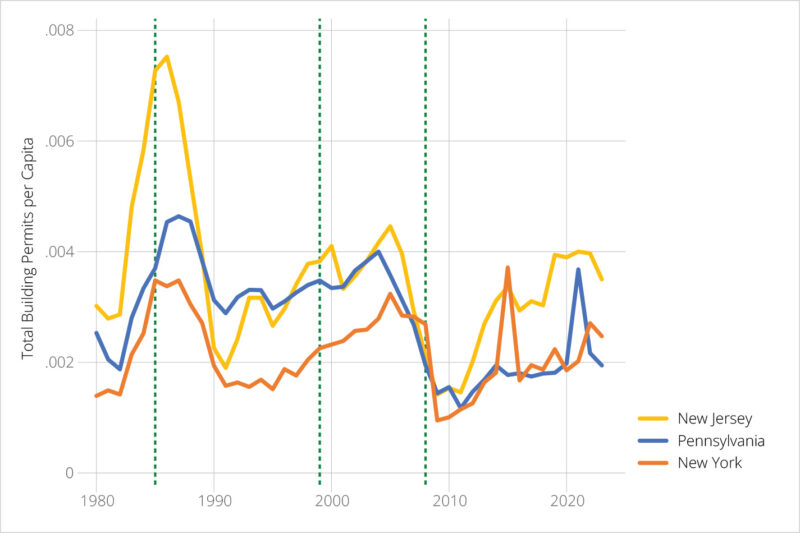
Figure 1: Total Building Permits per Capita in New Jersey and Neighboring States
We see here that before 1985, New Jersey was permitting a lot more units per capita than Pennsylvania and New York were. Shortly thereafter, however, New Jersey permitting plunged, and it remained more or less at Pennsylvania’s level until about 2012, when the state regained a small but steady advantage over its neighbors. These changes in permitting do not line up well with the enforcement of affordable housing obligations.
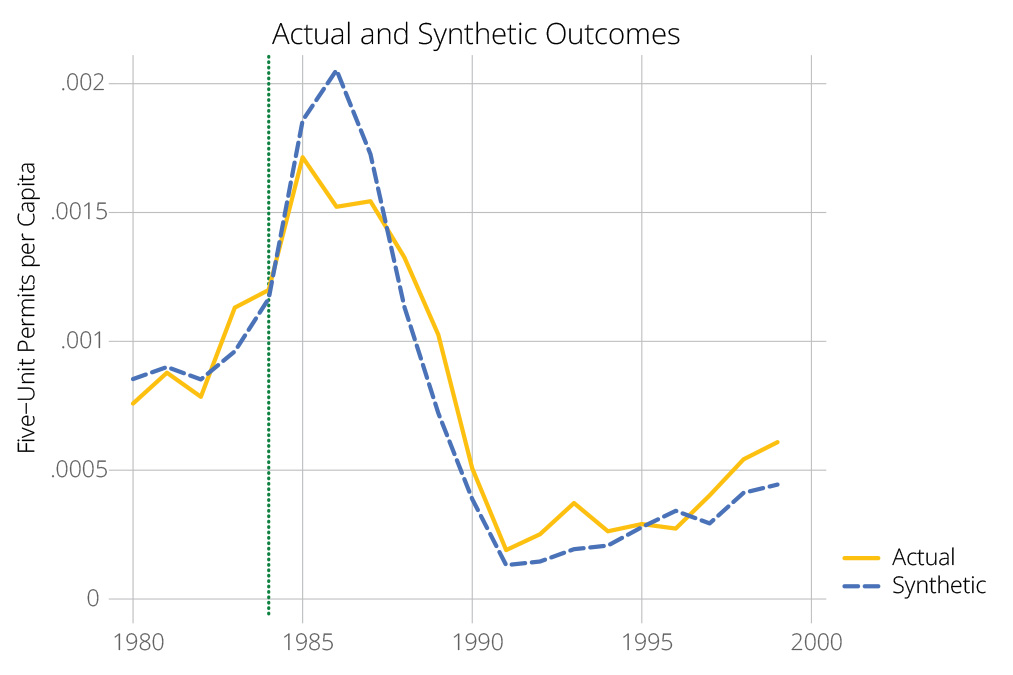
Figure 2 shows how building permits for units in buildings with five or more units evolved over time in the same group of three states.
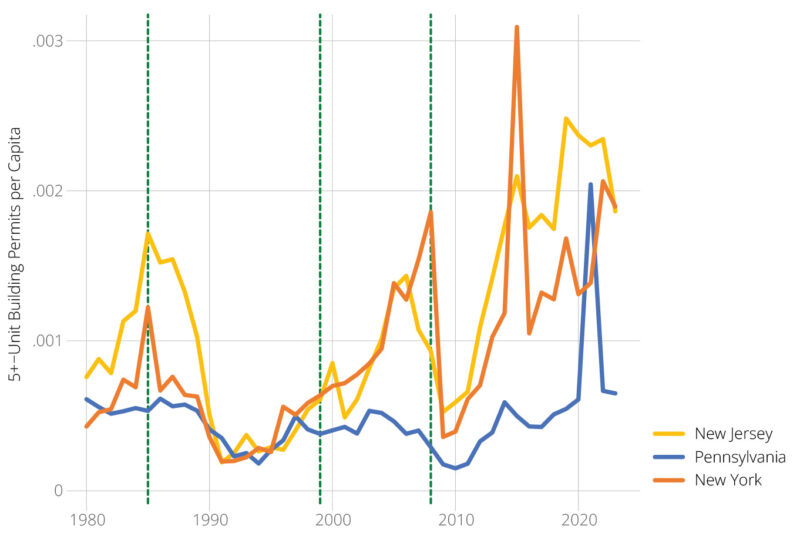
Figure 2: Five-Plus Building Permits per Capita in New Jersey and Neighboring States
The results here are similar to those in Figure 1, except that Pennsylvania and New York switch places. Pennsylvania produces more housing than New York, but New York produces more multifamily housing than Pennsylvania, which is not surprising since New York is more urbanized. After 1990, New Jersey’s permitting of larger multifamily buildings closely tracks New York’s, but New Jersey did have a slightly higher rate between 2016 and 2022.
So far, the raw data do not show a strong effect of affordable housing obligations on housing production in New Jersey. New Jersey is the most densely populated state in the country, so it makes sense that New Jersey would produce a larger share of multifamily housing than a state like Pennsylvania. But only in the last few years has New Jersey produced more overall housing than Pennsylvania. There is no evidence that the 1985 to 1999 period specifically was more productive of housing in New Jersey than other periods, or that the 2000 to 2007 period was particularly unproductive, except perhaps relative to the post-2012 period.
Of course, building permits are a measure of quantity supplied, but economics teaches us that both supply and demand jointly determine an equilibrium. We cannot reason from quantity changes alone that New Jersey’s affordable housing obligations did not work, because perhaps New Jersey had abnormally low housing demand, which caused builders to want to build less regardless of regulations. If affordable housing obligations corresponded to periods of slow growth in the cost of living in New Jersey, we could infer that these obligations boosted housing supply after all.
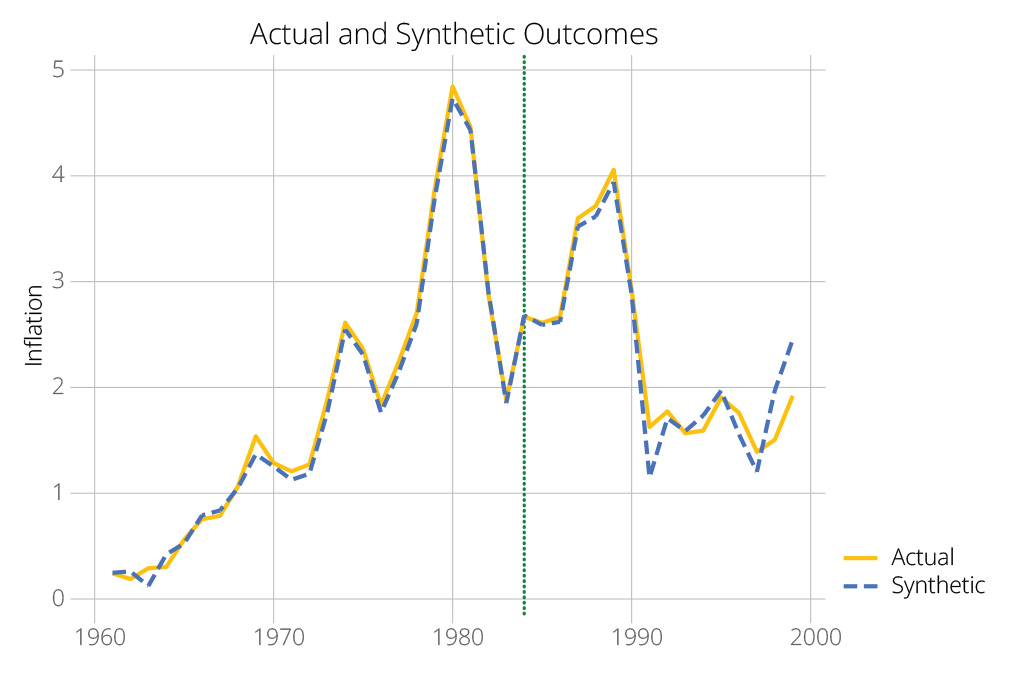
Figure 3 shows the evolution of state cost of living from 1960 to 2007 for New Jersey and its larger neighbors.
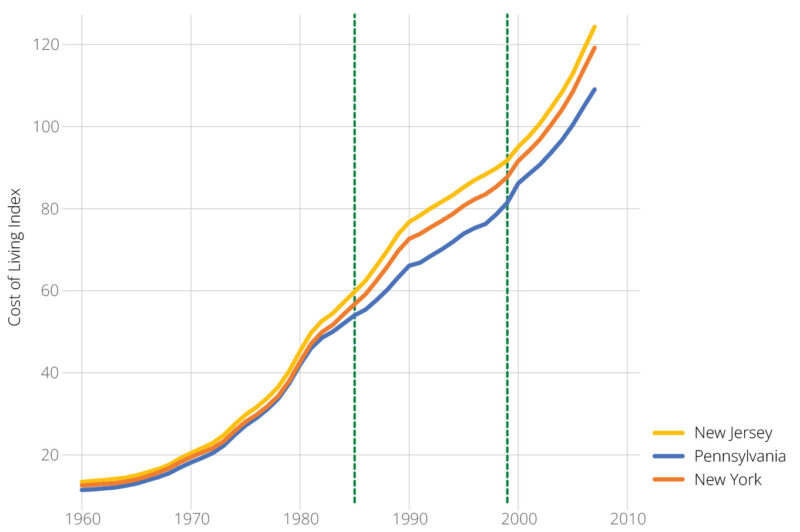
Figure 3: Cost of Living in New Jersey and Neighboring States
This chart suggests as well that affordable housing obligations did not work. Cost of living in New Jersey grew more rapidly than in neighboring states between 1980 and 1990 and since then has remained consistently higher. This evidence suggests that demand for housing in New Jersey was growing rapidly in the 1980s, and more housing units would have been supplied to meet market conditions even in the absence of affordable housing obligations. It’s even possible that affordable housing obligations suppressed supply through the regulatory incentives established by inclusionary zoning.
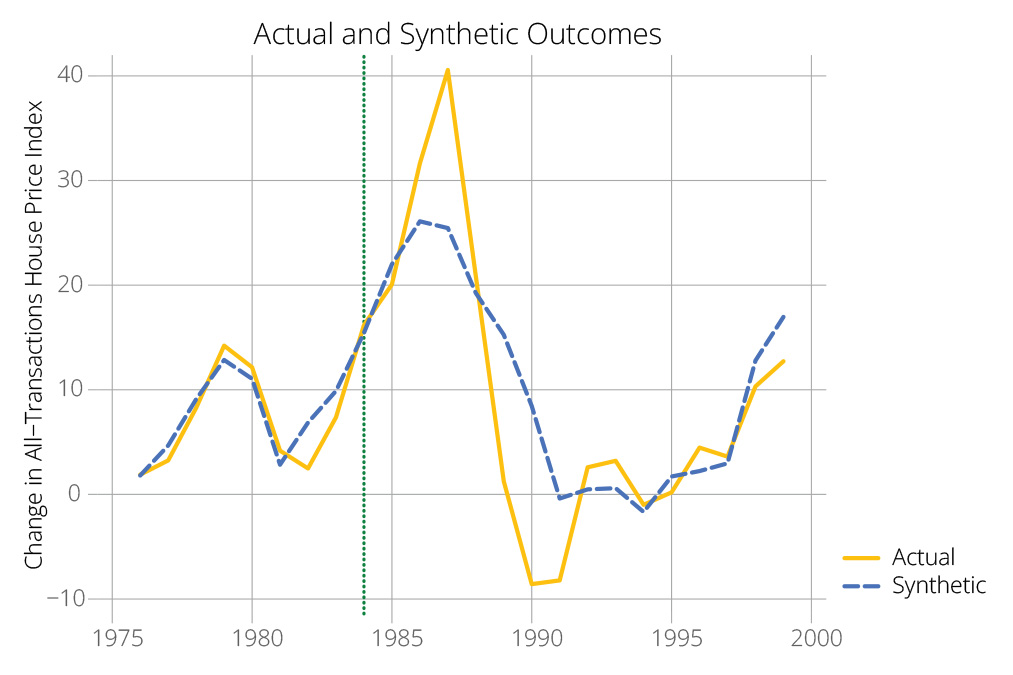
Finally, Figure 4 plots the annual change in the house price index for all three states. It is important to note here that the house price index is specific to each state, so levels are not comparable across states, only changes are. Every state’s house price index is set to 100 in the first quarter of 1980.
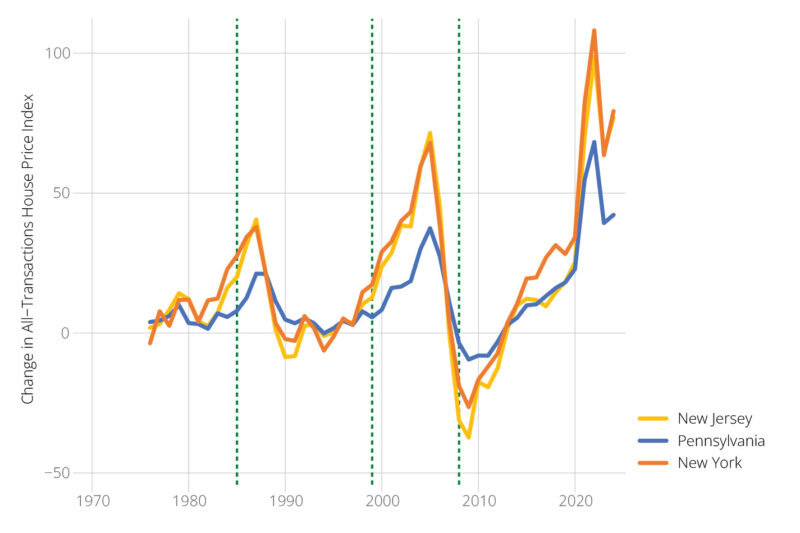
Figure 4: Changes in House Prices in New Jersey and Neighboring States
New Jersey house prices mostly change in lockstep with New York’s. But between 2015 and 2020 there is a brief period when New Jersey’s house prices rose less rapidly than New York’s. We probably shouldn’t overinterpret six years of data in this time series, but in concert with the evidence from Figure 2 it might suggest that the period of court supervision of Mount Laurel obligations was more productive for housing than either the period of legislative supervision or the period when these obligations were mostly not enforced.
Still, these charts are not conclusive. We can investigate the effects of New Jersey’s affordable housing obligations using synthetic control analysis (Abadie, et al., 2015). Synthetic control creates a weighted average of similar units to the treated unit, then compares the actual results in the treated unit to the counterfactual results represented by the weighted average of similar units. The treatment effect of the intervention equals actual New Jersey’s value minus synthetic New Jersey’s value on an outcome.
I used the immediate lag of the dependent variable, population, personal income, land area, and number of local governments per square mile from Ruger and Sorens (2023) to create a “synthetic” New Jersey from other states. In the change in cost of living and change in house prices analyses, I also used the one-year lag of the level of each index to capture any scale effects occurring in long time series of price indices. This synthetic New Jersey is as similar as possible to the real New Jersey, allowing us to investigate the counterfactual building permits, cost of living, and housing costs that would have occurred in New Jersey in the absence of the Mount Laurel affordable housing obligations.
I look at two treatment periods, the first when the legislature made Mount Laurel obligations effective from 1985 to 1999, and the second when neither the legislature nor the courts were enforcing Mount Laurel obligations (2000 to 2007). Separate synthetic control analyses are run for each period.
| Outcome: | Total units | Total units | 5-Unit permits | 5-Unit permits | Δ Cost of living | Δ Cost of living | Δ House price index | Δ House price index |
| Treatment period: | 1985-1999 | 2000-2007 | 1985-1999 | 2000-2007 | 1985-1999 | 2000-2007 | 1985-1999 | 2000-2007 |
| Massachusetts | 0.66 | 0.58 | 0.82 | 0.22 | 0.6 | 0.29 | 0.44 | 0.2 |
| Pennsylvania | 0.24 | 0.17 | 0.17 | 0.22 | 0.52 | |||
| Connecticut | 0.13 | 0.46 | 0.14 | 0.38 | ||||
| New York | 0.02 | 0.23 | 0.17 | 0.28 | 0.09 | 0.16 | 0.01 | |
| Florida | 0.09 | 0.27 | ||||||
| Nevada | 0.07 | 0.04 | ||||||
| Arizona | 0.02 | |||||||
| Hawaii | 0.25 | |||||||
| California | 0.1 |
Table 1: Construction of Synthetic New Jersey in Each Analysis
Because I’m running eight different synthetic control analyses (two treatment periods combined with four outcomes), the precise content of synthetic New Jersey varies from analysis to analysis. Table 1 shows how synthetic New Jersey is constructed in each analysis; the numbers represent the weights on each state.
Unsurprisingly, neighboring states New York and Pennsylvania contribute a lot to many of these analyses. Massachusetts is the only state that contributes to synthetic New Jersey in every analysis. The biggest surprise is to see Hawaii enter as a significant contributor to synthetic New Jersey in the 1985–1999 house price index analysis. Otherwise, unusual states make up only a very small proportion of synthetic New Jersey in each instance.
Predictor balance was largely good, with treated and synthetic New Jersey matching closely on population, personal income, and effective competing jurisdictions per square mile. However, treated New Jersey land area was generally about a half to a quarter of synthetic New Jersey’s. New Jersey is abnormally small for its population and personal income (it is the most densely populated state), and it’s hard for the algorithm to replicate that pattern with other states.
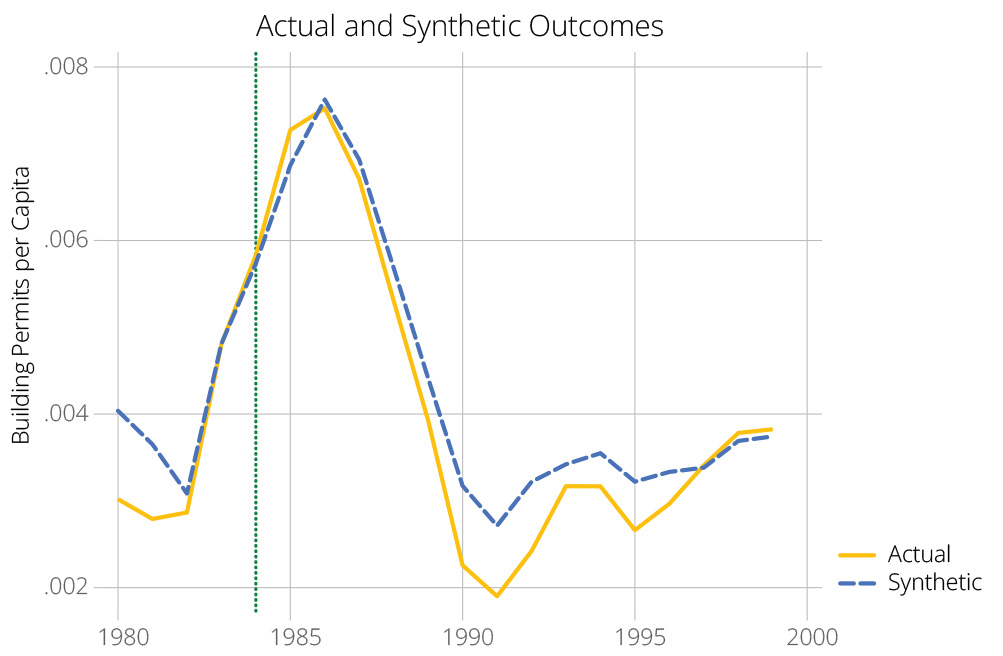
Figure 5 shows the results of the synthetic control analyses of total building permits per capita for the two treatment periods.
 |
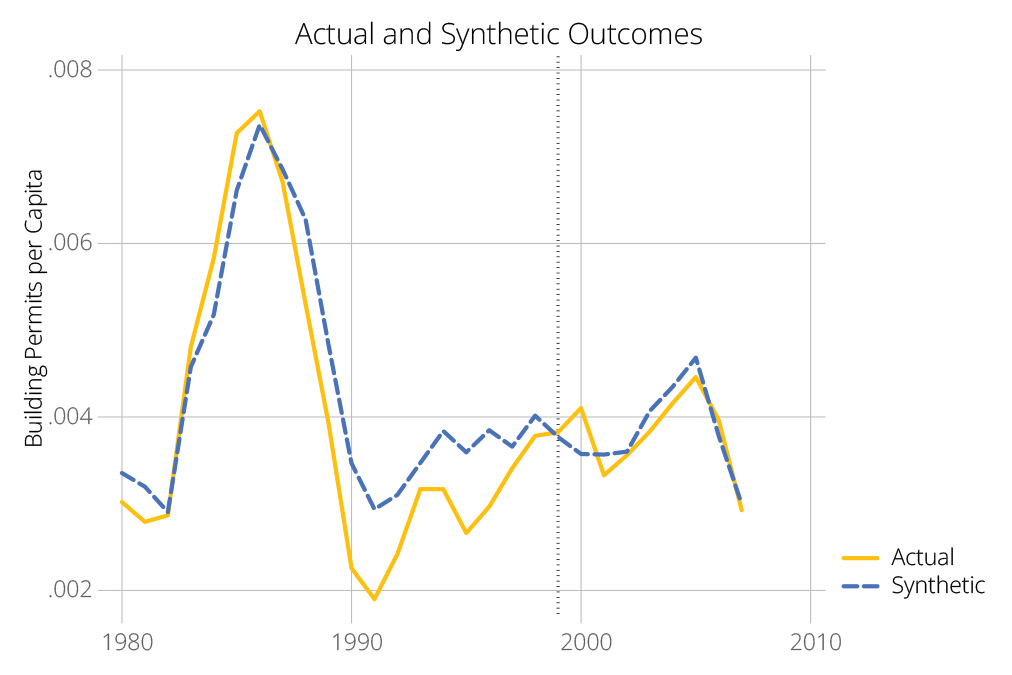 |
Figure 5: Synthetic Control Analysis of New Jersey Total Building Permits
The synthetic control algorithm ends up replicating New Jersey’s pre-treatment permitting extremely closely in the earlier period and only moderately closely in the later period. New Jersey’s actual permitting fell below its counterfactual permitting over most of the earlier treatment period, corresponding to the first legislatively enforced Mount Laurel regime. But the differences are tiny in an absolute sense, and when we take into account normal variation in other states, they are not statistically significant in any year. The same is true of the treatment effects in the later period, corresponding to no enforcement of Mount Laurel obligations, except in 2000, where the result goes in the “wrong” direction (New Jersey built more than expected). In other words, neither legislative enforcement of Mount Laurel nor a suspension of Mount Laurel made any difference to New Jersey residential building permits.
Figure 6 presents equivalent results for five-unit production.
 |
 |
Figure 6: Synthetic Control Analysis of New Jersey Five-Unit Building Permits
The results are basically the same. The only statistically significant results based on standardized p-values are in 1986 and 2000, but they go in the “wrong” direction, suggesting that New Jersey had abnormally few five-unit permits in 1986 and abnormally many five-unit permits in 2000.
Figure 7 moves on to general inflation. Here, we would expect legislative enforcement of Mount Laurel to reduce state inflation rates and no enforcement of Mount Laurel to increase them, if the system actually promoted housing supply.
 |
 |
Figure 7: Synthetic Control Analysis of New Jersey Inflation
Here, we are able to model New Jersey’s pretreatment inflation extremely closely and accurately. Once again, we find essentially no effect of the Mount Laurel regime. None of the treatment effects are close to statistical significance, except in 2002, where the result suggests that the lack of Mount Laurel enforcement may have added a tenth of a percentage point to the state’s inflation rate. But for most years, the data suggest that Mount Laurel has made no difference to general inflation in New Jersey.
Next, Figure 8 looks at the results for change in the all-transactions house price index.
 |
 |
Figure 8: Synthetic Control Analysis of Change in New Jersey House Prices
The results here are all over the map, suggesting that Mount Laurel enforcement raised house prices in 1986 and 1987 and cut them in 1989, 1990, and 1991. The average treatment effect over the first period is -1.2, corresponding to about a 0.5 percent change in house prices over the whole 1985–1999 era. After enforcement was removed, house prices rose, but only in two years was that increase statistically significant: 2002 and 2006. The average treatment effect over this period is 11.7, corresponding to about a 2.7 percent change in house prices during that era. There is inconsistent evidence that Mount Laurel enforcement kept house prices down slightly.
When we put all this evidence together, it suggests that Mount Laurel enforcement did not increase housing supply. It may have cut housing prices slightly without increasing permitting, suggesting a reduction in demand for housing, but those changes were too slight to make any impact on broader state-level inflation.
4. Discussion
The results from the foregoing analyses suggest that the Mount Laurel doctrine and multiple rounds of affordable housing obligations dating back at least 39 years have done nothing, or next to nothing, to make housing more abundant or affordable in New Jersey. This is a disappointing result, perhaps, but it’s hard to see it as a surprising one, since New Jersey remains a costly state for housing and relatively slow-growing compared to Sunbelt states that make it easy to build.
Some of the evidence suggests that New Jersey built a lot of housing during 2015 to 2020, and that this period also corresponded to a moderation in house price increases. This was a period of judicial enforcement of Mount Laurel obligations without any legislative framework. At least, the results still support pessimism about the legislature’s ability to come up with criteria for Mount Laurel compliance that foster growth in housing supply.
These results also shouldn’t be surprising since the bulk of the scholarship on the question finds that inclusionary zoning policies tend to make housing less affordable, less abundant, or both. The Fair Housing Act’s mandating of voluntary inclusionary zoning and encouragement of mandatory inclusionary zoning has, at minimum, counteracted the intent of the law to make housing more available to families of modest income.
New Jersey is currently undergoing a fourth round of affordable housing obligations, and the process has generated much controversy. The law, Act 2 of 2024, requires the Department of Community Affairs to develop municipality-specific affordable housing obligations under a detailed, precise formula. Those obligations go into force this year.
Parts of the law’s formula are worth questioning. First of all, “Qualified Urban Aid” municipalities are exempted entirely from the law. This might make sense if all of these municipalities already offered abundant affordable housing, but that is not necessarily the case. Municipalities can qualify for this list if they have a high proportion of substandard and deficient housing or simply a high population density.
Second, Prospective Need – the new affordable housing obligation – is calculated on the assumption that 40% of the housing demand in every region and in every municipality will come from low and moderate income (LMI) households. This ignores the likelihood that LMI households prefer to live in some places rather than others (for instance, places with access to public transit or walkable to employment).
Communities end up with a higher quota if they have had more rapid commercial valuation growth over the previous decade. This provision encourages communities to squelch commercial development. Moreover, commercial valuation growth does not necessarily imply employment growth. Smart-growth principles suggest using employment growth instead to determine housing need.
The formula also includes an income capacity factor, which punishes communities not just for being wealthy, but also for having a small population, because it averages a purely income-based measure with a household-weighted income-based measure. To avoid penalizing communities for having a small number of households, the measure should simply be the household-weighted measure.
The law does take into account land capacity of the municipality, which is supposed to reduce new housing obligation for already built-out municipalities. However, the calculation depends in part on Geographic Information Systems (GIS) land-cover and tax map data that are often not sufficiently granular, accurate, and up-to-date for the purpose.
Finally, the “allocation factors” are simply averaged to produce the fair share calculation, with no justification. For example, the small community of Monmouth Beach has complained about its positive Prospective Need number, given that it has zero developable land.
Given these problems, it is no wonder that the renewed affordable housing obligations are facing strong resistance around the state. Sometimes state governments do need to put guardrails on the municipal zoning power, but in general, mandates on the number of units to produce do not work well, because they encourage wasteful litigation, and municipalities are often able to avoid them through sub rosa methods like delaying permits, requiring extra studies, and zoning land for development that is not actually developable.
5. Conclusion and Recommendations
Is the Mount Laurel doctrine working for New Jersey? Not in its legislative interpretations to date. The legislative framework based in 1985’s Fair Housing Act has demonstrably failed to solve the affordable housing problem in New Jersey. In fact, there’s no evidence it has increased permitting at all, and precious little that it has brought down the cost of housing in the state.
Three recommendations for reform follow.
- As mentioned, Act 2 exempts urban municipalities from affordable housing mandates. This exemption makes little sense if one’s goal is to provide more affordable housing where there is demand for it. Act 2 could therefore be amended to apply to all municipalities in the state, and the quantitative housing mandates recalculated. Some lawmakers may question this approach on the grounds that higher affordable housing mandates for suburban and rural municipalities will be more likely to reduce residential segregation. But it is a generally valid maxim that when one aims at two targets at once, one risks hitting neither. A better way to deal with segregation would be to address its negative consequences directly.
- A modest reform would shift affordable housing targets from municipal to regional bodies, either the existing county planning boards or new regional authorities created by legislation. These bodies could review development applications specifically for affordable housing developments, in consultation with the municipalities involved. A regional target system would be more flexible than the existing municipal target system, and could allow market demand to have a greater say in where these projects occur.
- New Jersey lawmakers should consider repealing Act 2 entirely and discuss ways to leverage private property rights and the free market to grow housing supply, such as by conferring definite development rights for certain types of projects based on site and infrastructure conditions.
- The state can also speed up permitting with shot-clocks, third-party permitting, and broadened exemptions from special permit requirements. The Mercatus Center publishes an annual report on the state legislative “toolbox” for housing, a useful source of ideas on this front (Furth, et al., 2024).
Instead of detailed affordable housing mandates that have spawned an entire litigation industry, the state should move toward regulatory reforms aimed at general housing abundance. The state could still financially reward towns that actually permit a lot of new building, but those rewards should come after the permits have been issued, not after mere rezonings. This approach would build a more collaborative relationship between the state and municipalities and also make it easier for builders to know what they can build and where, without having to go through years of legal rigmarole. These reforms would make housing more abundant where it’s needed, bringing down the cost and doubling down on New Jersey’s existing economic strengths, like a skilled, urbanized workforce and strong industrial and port infrastructure.
Acknowledgments
The author thanks Audrey Lane for editorial support and guidance and anonymous referees for helpful feedback. All remaining errors are the author’s responsibility.
References
Abadie, A., Diamond, A. & Hainmueller, J., 2015. Comparative Politics and the Synthetic Control Method. American Journal of Political Science, 59(2), pp. 495-510.
Aten, B. H., 2017. Regional Price Parities and Real Regional Income for the United States. Social Indicators Research, 131(1), pp. 123-143.
Bento, A., Lowe, S., Knaap, G.-J. & Chakraborty, A., 2009. Housing Market Effects of Inclusionary Zoning. Cityscape, 11(2), pp. 7-26.
Berry, W. D., Fording, R. C. & Hanson, R. L., 2000. An Annual Cost of Living Index for the American States, 1960-1995. Journal of Politics, 62(2), pp. 550-567.
Furth, S., Hamilton, E. & Gardner, C., 2024. Housing Reform in the States: A Menu of Options for 2025, Arlington, Va.: Mercatus Center at George Mason University.
Hamilton, E., 2021. Inclusionary Zoning and Housing Market Outcomes. Cityscape, 23(1), pp. 161-194.
Hollingshead, A., 2015. When and How Should Cities Implement Inclusionary Housing Policies?, Berkeley, Calif.: Cornerstone Partnership.
Means, T. & Stringham, E. P., 2012. Unintended or Intended Consequences? The Effect of Below-Market Housing Mandates on Housing Markets in California. Journal of Public Finance and Public Choice, 30(1-3), pp. 39-64.
Ruger, W. & Sorens, J., 2023. Freedom in the 50 States: An Index of Personal and Economic Freedom. 7th ed. Washington, D.C.: Cato Institute.
Schuetz, J., Meltzer, R. & Been, V., 2011. Silver Bullet or Trojan Horse? The Effects of Inclusionary Zoning on Local Housing Markets in the United States. Urban Studies, 48(2), pp. 297-329.
End Notes
[1] Southern Burlington County N.A.A.C.P. v. Township of Mount Laurel, 67 N.J. 151 (1975).
[2] Monaghan, Justin M., and William Penkethman Jr. “The Fair Housing Act: Meeting the Mount Laurel Obligation with a Statewide Plan.” Seton Hall Legis. J. 9 (1985): 585–619, 587.
[3] Southern Burlington County NAACP v. Mount Laurel Township, 92 N.J.
158, 456 A.2d 390 (1983).