
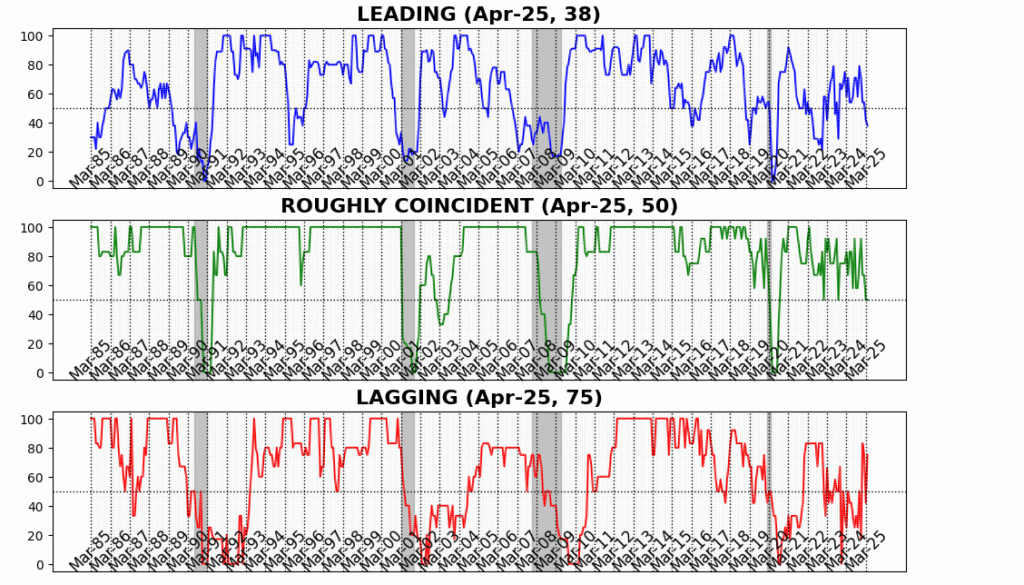
AIER’s Business Conditions Monthly indicators suggest that the US economy remained under pressure in April, with the Leading Indicator slipping further into contractionary territory. After March’s sharp 12-point drop, the Leading Indicator declined an additional 4 points in April, landing at 38 — its lowest reading since October 2023 and a sign that forward-looking economic momentum continues to erode.
The Roughly Coincident Indicator held steady at 50, matching its March level. While this neutral reading may appear stable on the surface, it masks the underlying loss of pace that followed a string of stronger readings earlier in the year. The Lagging Indicator, by contrast, rebounded strongly — jumping 33 points to 75 — erasing its March plunge and signaling that backward-looking measures such as credit delinquencies and business debt service remain relatively firm, at least for now. But such lags are typical in economic slowdowns and don’t alter the broader picture of softening conditions across forward and present-focused metrics.
Leading Indicator (38)
In April, the Leading Indicator fell further to 38, down from 42 in March, marking its lowest reading since October 2023. The index reflected weakness across the majority of components, with only four of twelve showing improvement and the rest contributing negatively or remaining flat.
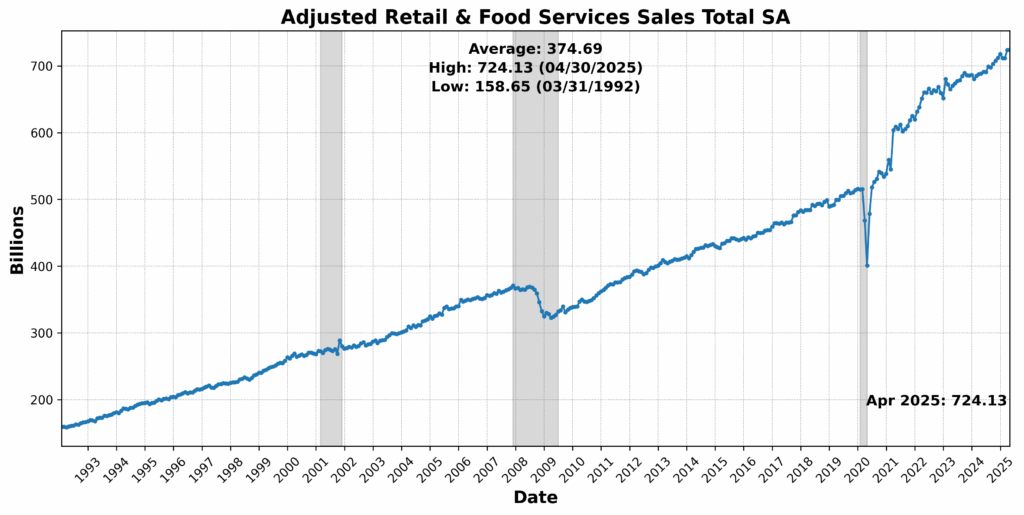
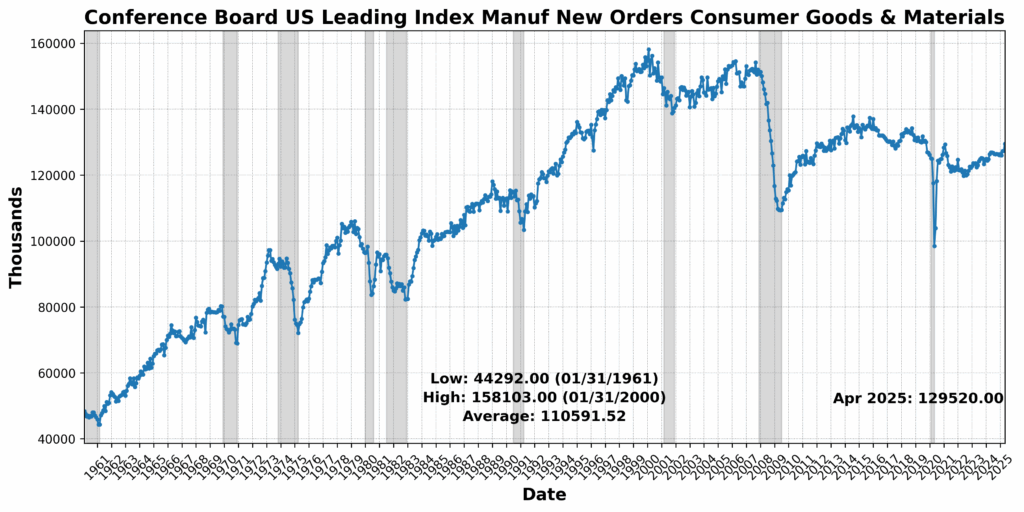
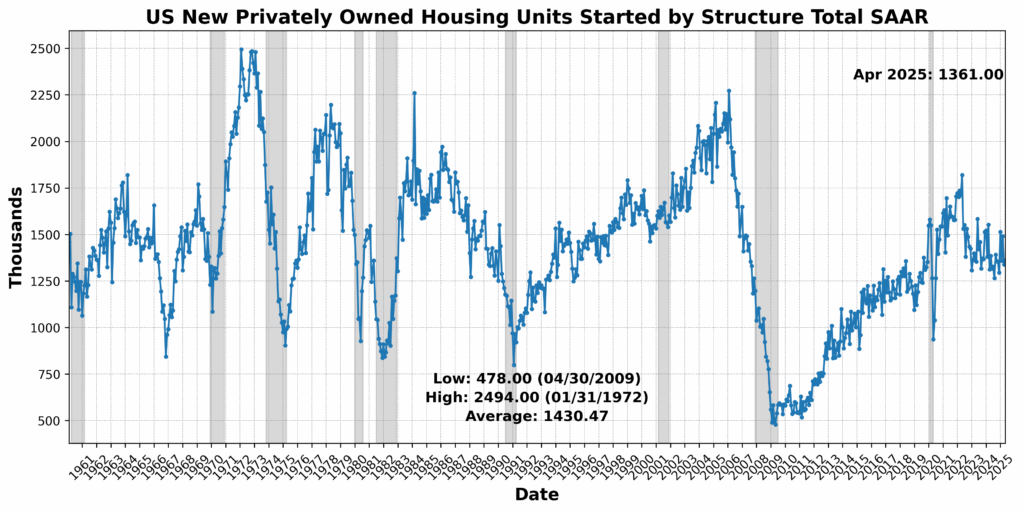
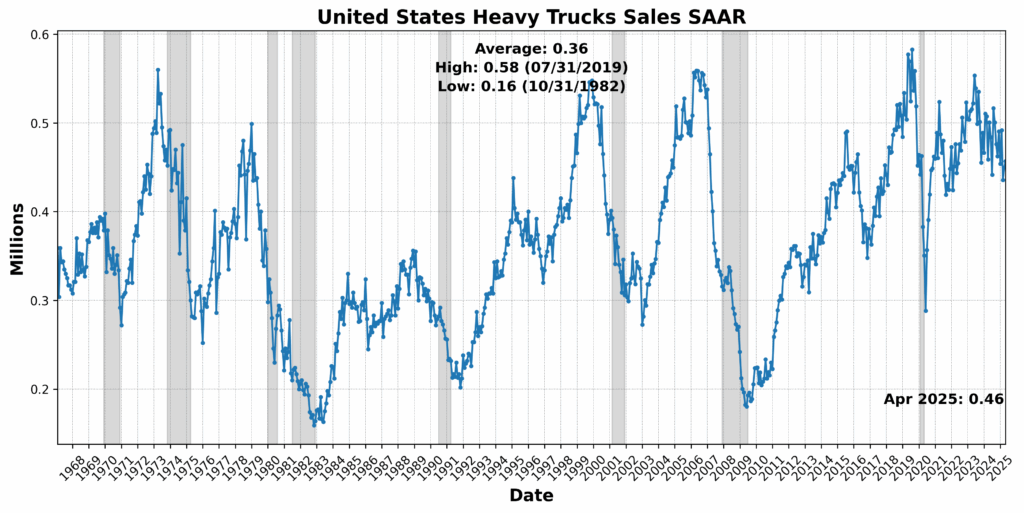
The strongest gains came from the Conference Board US Leading Index Manufacturers’ New Orders: Consumer Goods and Materials, up 1.7 percent, and US New Privately Owned Housing Units Started by Structure Total SAAR, which rose 1.6 percent — a sign that despite higher interest rates, housing construction remains resilient in some regions. United States Heavy Trucks Sales SAAR also rose 1.6 percent, potentially reflecting fleet investment or increased freight activity. Adjusted Retail and Food Services Sales Total seasonally adjusted (SA) posted a marginal gain of 0.1 percent, suggesting flat but stable consumer spending.
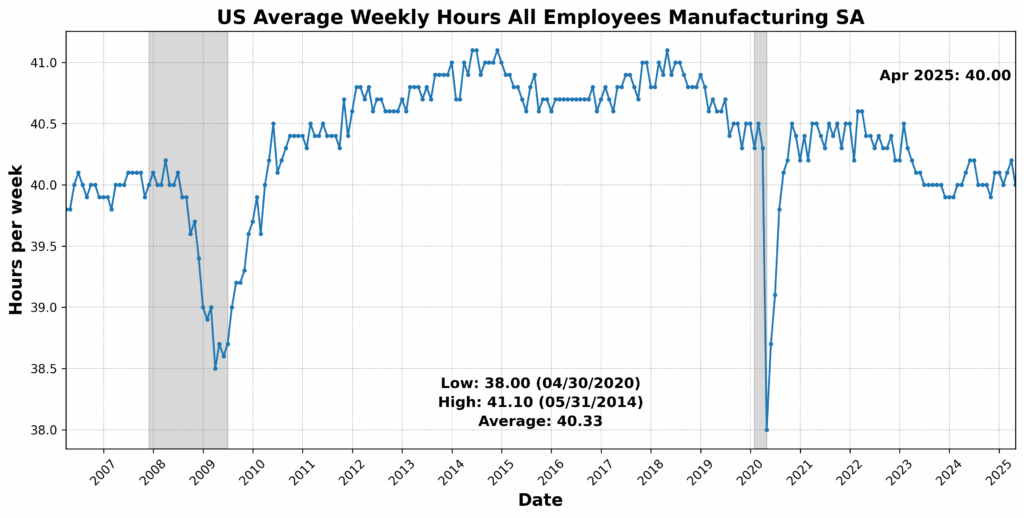
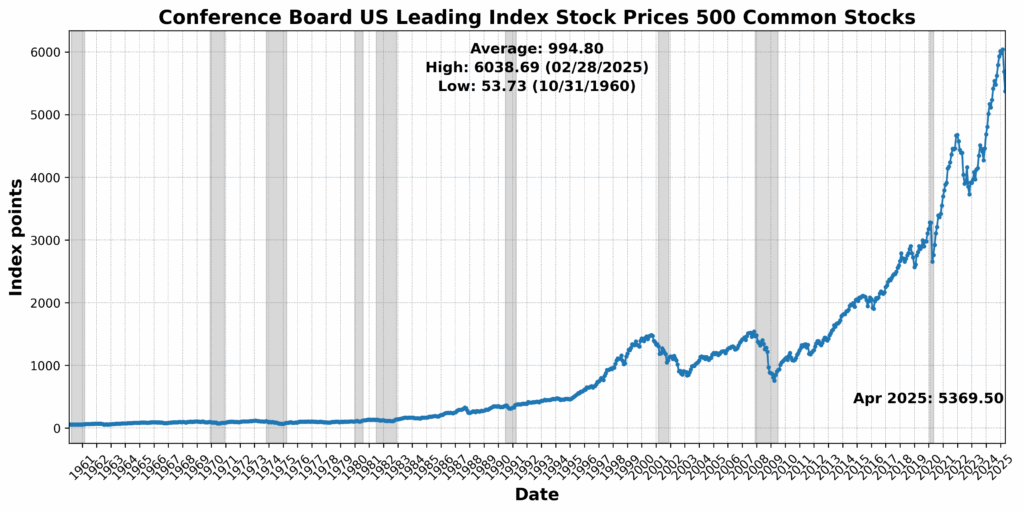
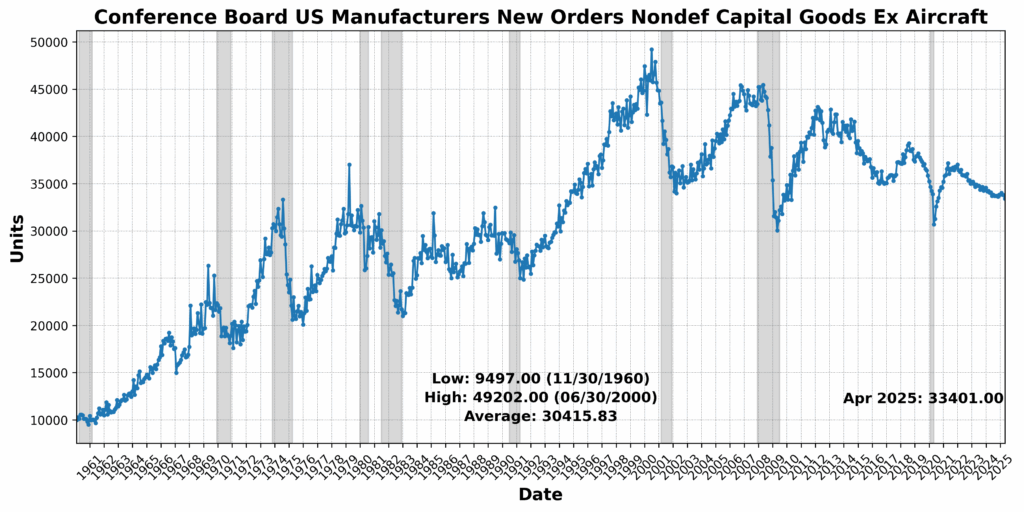
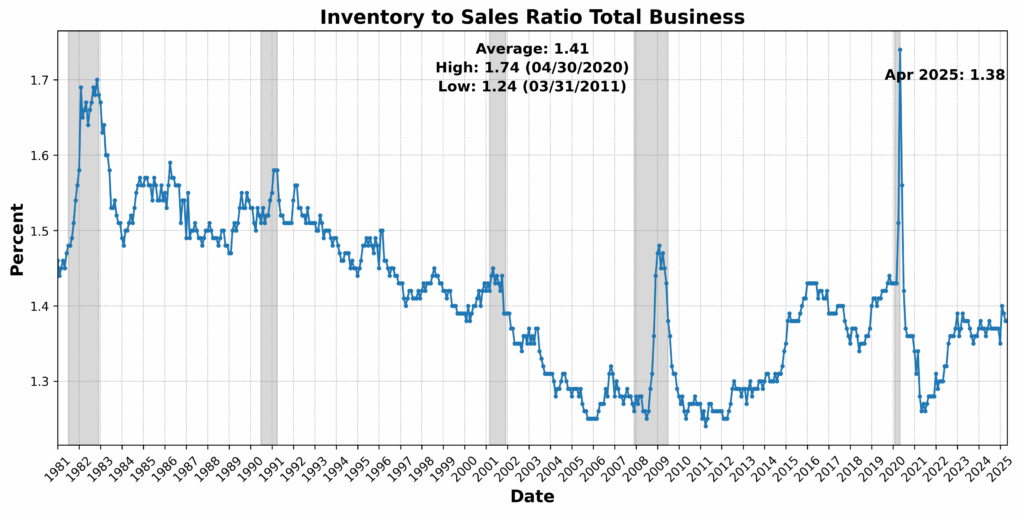
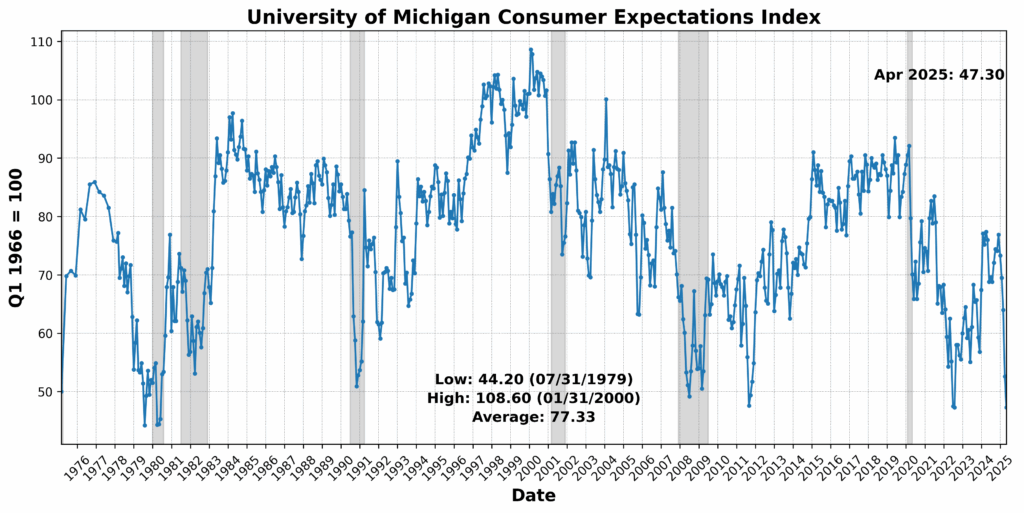
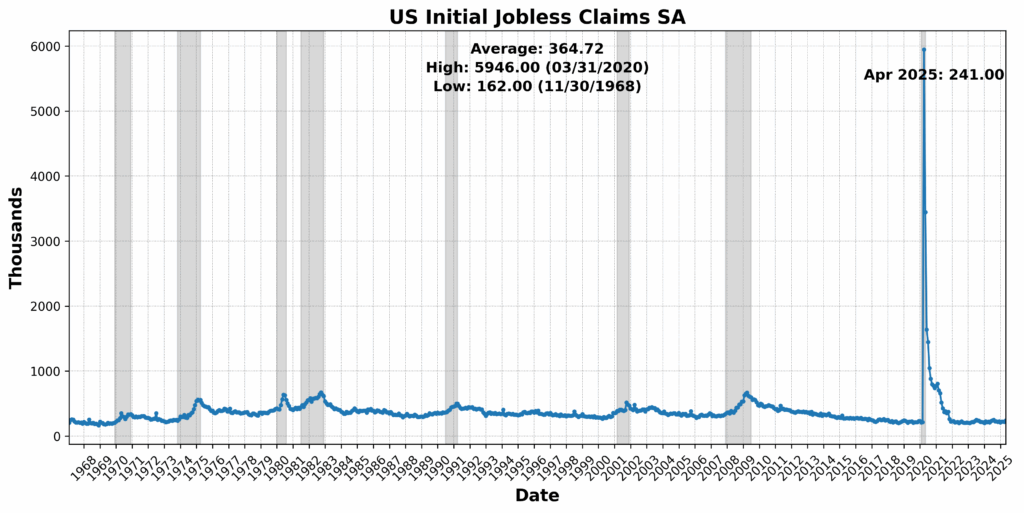
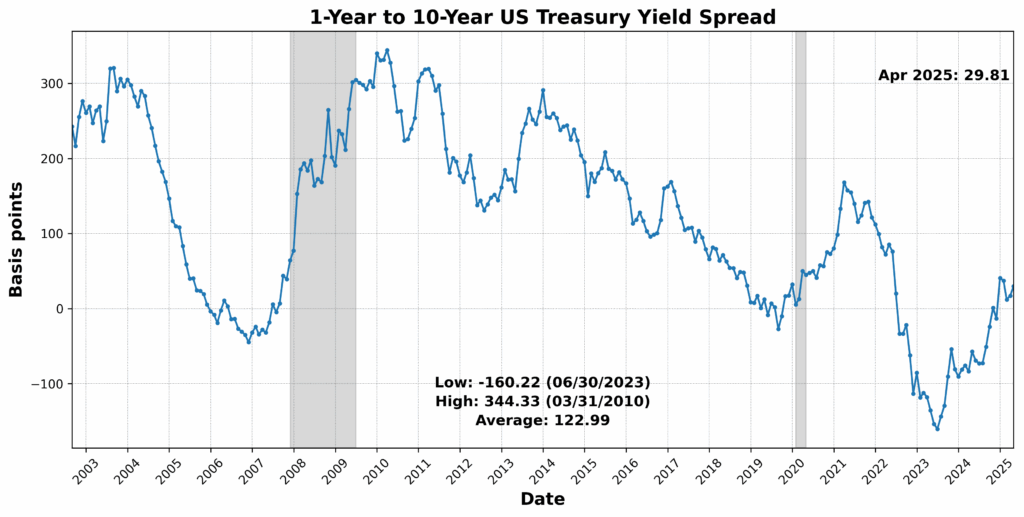
On the downside, the University of Michigan Consumer Expectations Index dropped sharply by 10.1 percent, signaling a weakening consumer outlook. US Initial Jobless Claims SA fell 10.0 percent — usually a positive sign — but in this context may reflect tightening labor conditions that are slowing momentum. Equity prices (via the Conference Board US Leading Index Stock Prices 500 Common Stocks) declined by 5.5 percent, while Debit Balances in Customers’ Securities Margin Accounts fell 3.4 percent, pointing to reduced investor risk appetite. Conference Board US Manufacturers’ New Orders Nondefense Capital Goods Ex Aircraft fell 1.1 percent, and US Average Weekly Hours All Employees Manufacturing SA slipped 0.5 percent — both early indicators of slowing industrial demand. The Treasury yield curve remained deeply inverted, with the 1-Year to 10-Year US Treasury Yield Spread at -73.4 percent, reinforcing recessionary signals. One component, the Inventory to Sales Ratio Total Business, was flat.
Altogether, the deterioration across a wide swath of leading components underscores rising downside risks for the US economy heading into mid-2025.
Roughly Coincident Indicator (50)
The Roughly Coincident Index remained unchanged at 50 in April, reinforcing the picture of a plateauing economy with little net forward momentum. Three of the six underlying indicators rose, while three declined — continuing the trend of mixed but stable readings.
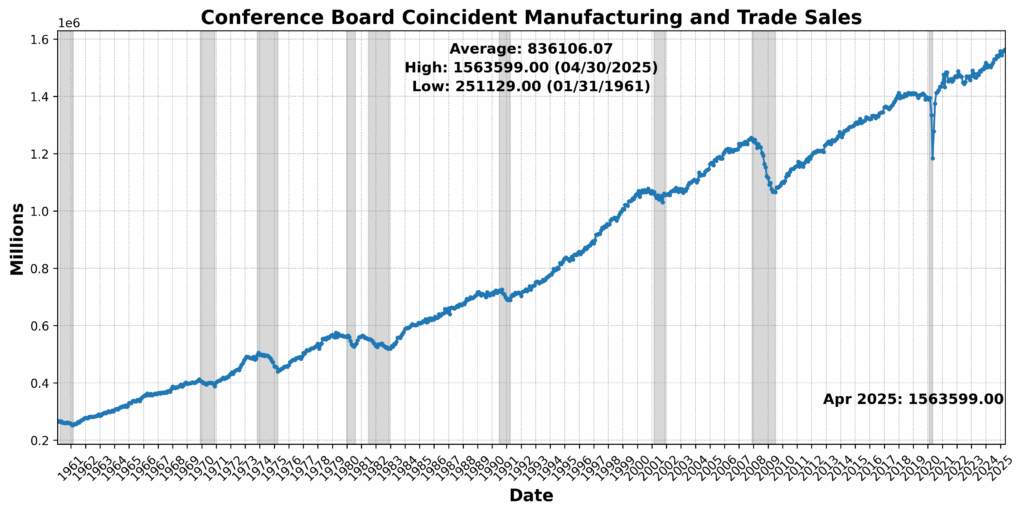
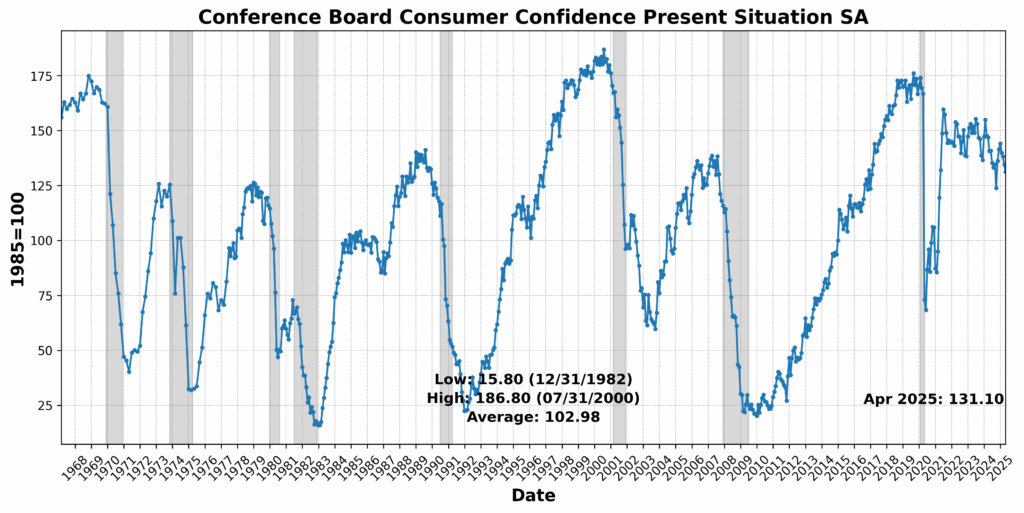
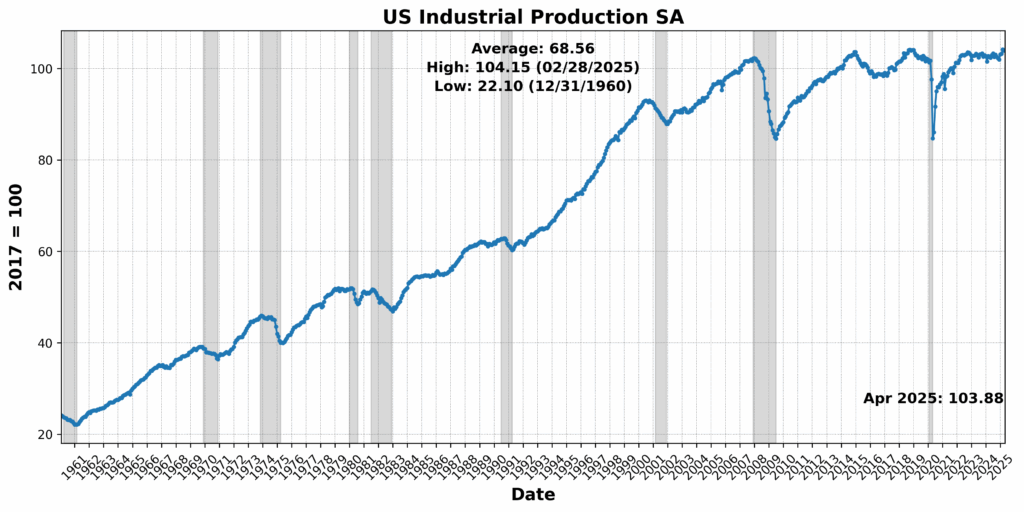
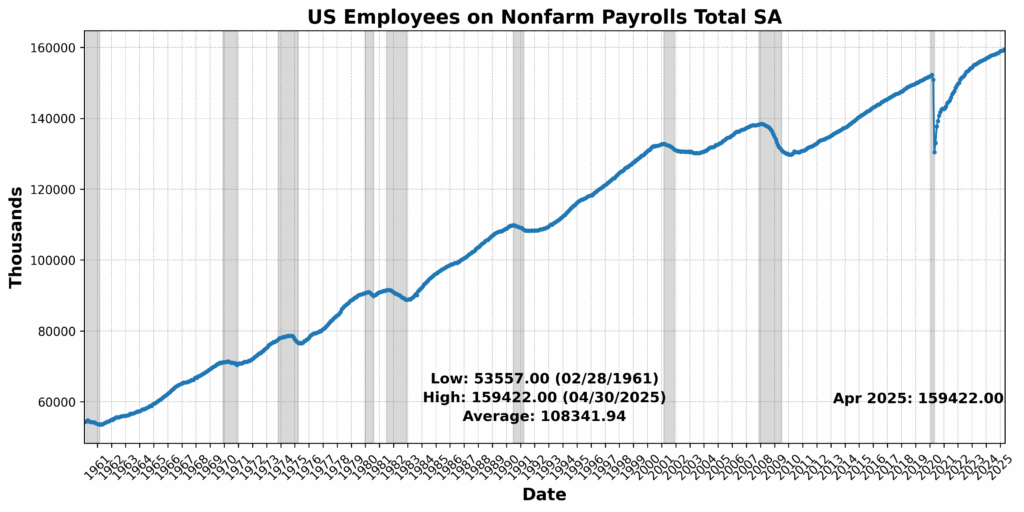
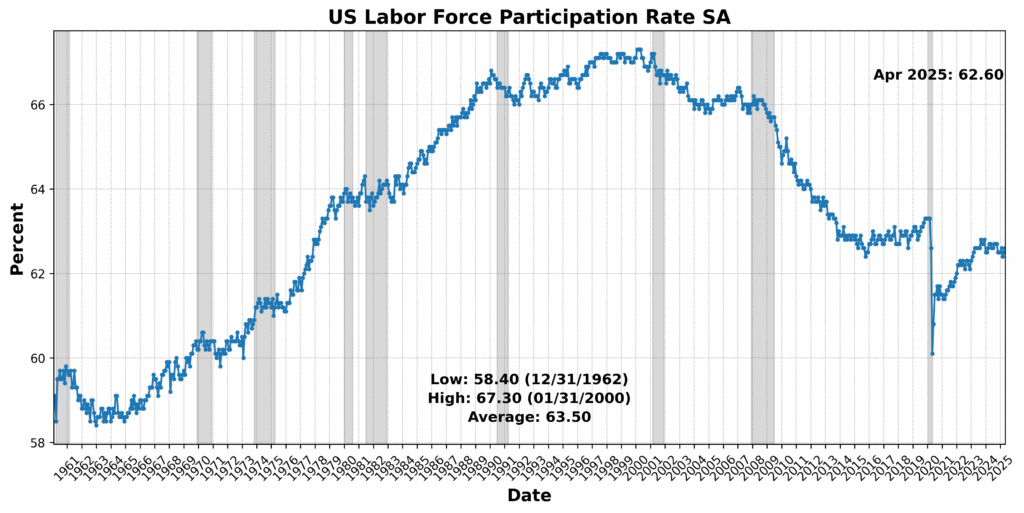
Conference Board Coincident Personal Income Less Transfer Payments rose 0.5 percent, suggesting some resilience in household earnings. Conference Board Coincident Manufacturing and Trade Sales edged up 0.2 percent, and US Employees on Nonfarm Payrolls Total SA saw a modest gain of 0.1 percent. However, the US Labor Force Participation Rate SA slipped by 0.2 percent, and US Industrial Production SA was essentially flat, down 0.0 percent. The sharpest move came from Conference Board Consumer Confidence Present Situation SA, which fell 2.5 percent, highlighting persistent caution among households despite stable labor and income trends.
Lagging Indicator (75)
The Lagging Index rose sharply to 75 in April, up from 42 in March, driven by broad-based gains across components — with five of six showing positive movement and only one declining.
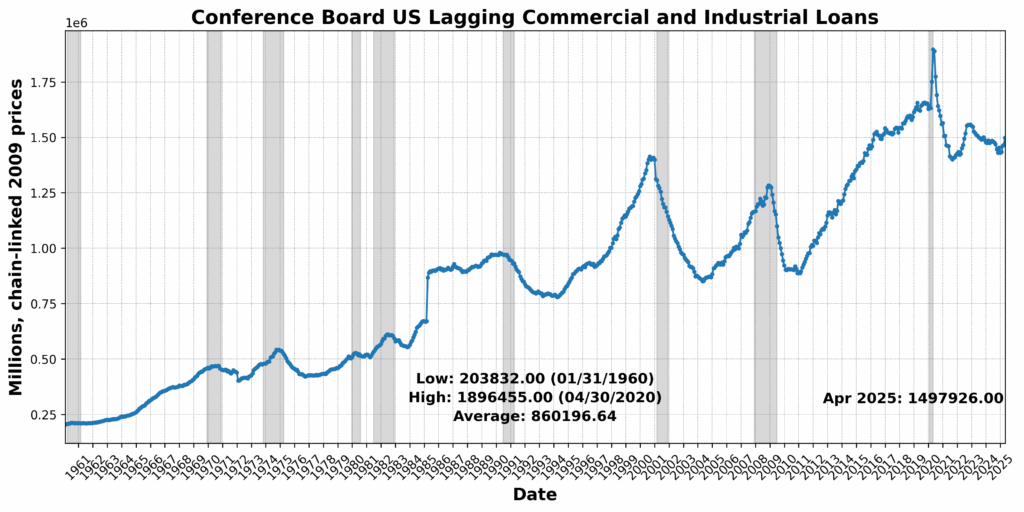
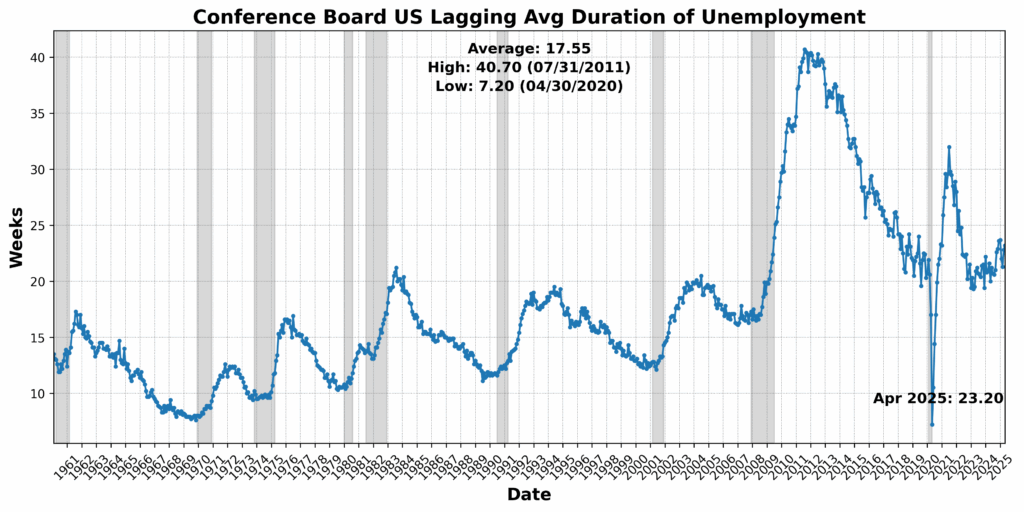
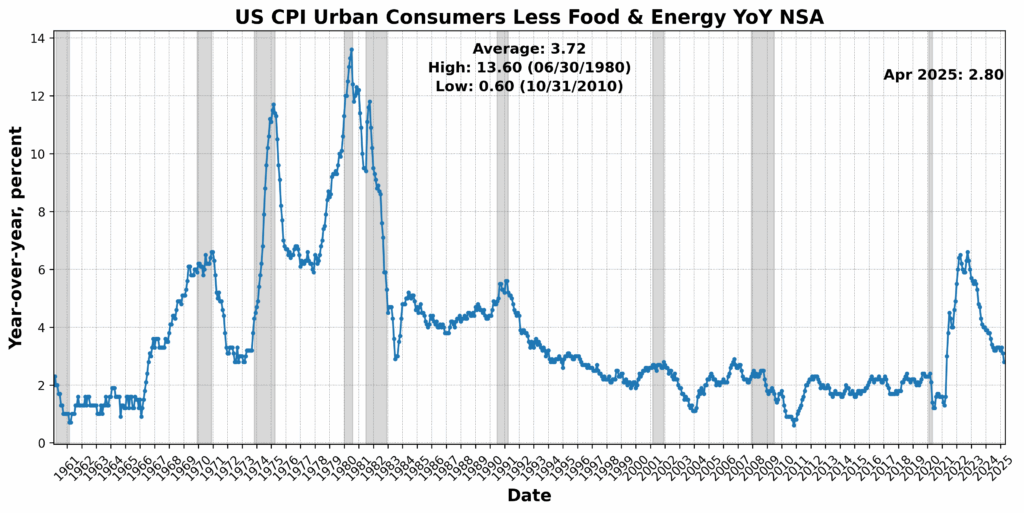
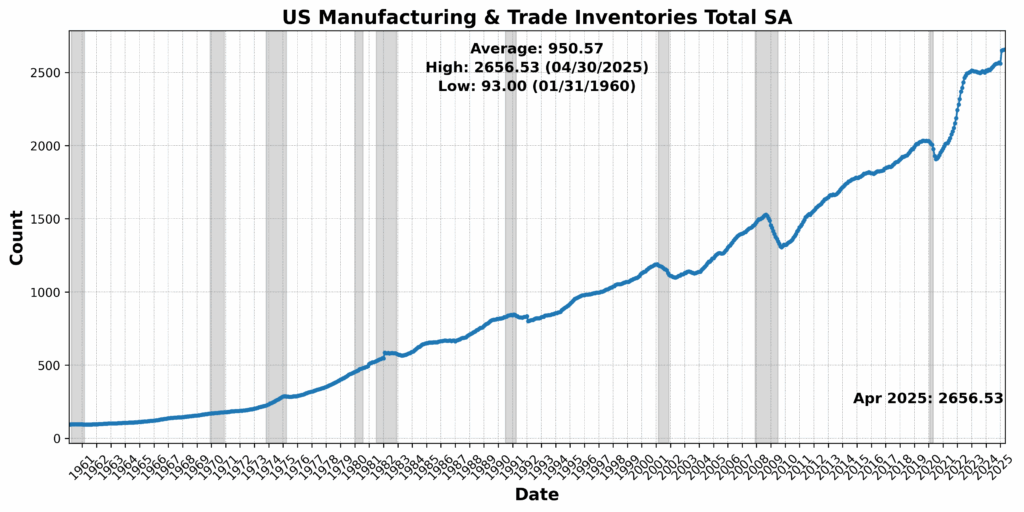
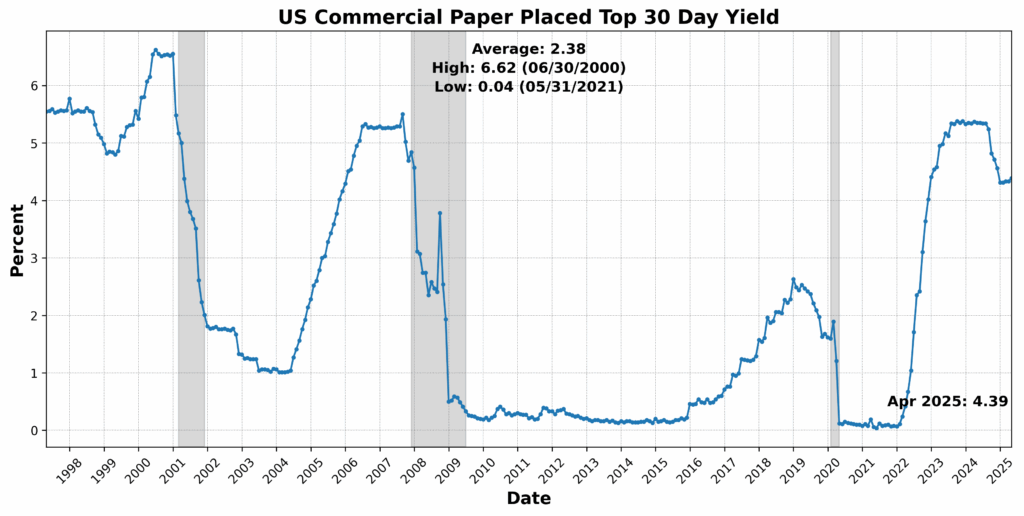
Conference Board US Lagging Commercial and Industrial Loans rose 2.1 percent, while Conference Board US Lagging Avg Duration of Unemployment increased 1.8 percent, pointing to a growing credit extension but also a longer job-search cycle. US Commercial Paper Placed Top 30-Day Yield climbed 1.4 percent, and US Manufacturing and Trade Inventories Total SA rose marginally. CPI for Urban Consumers Less Food and Energy, YoY NSA was unchanged, offering no disinflationary relief but no new inflation pressure either. The lone drag came from Census Bureau US Private Construction Spending Nonresidential SA, which declined 0.9 percent — a moderate pullback after earlier strength in the sector.
Altogether, the Lagging Index’s strong rebound reflects late-cycle dynamics: higher credit use, longer unemployment spells, and a firming of borrowing costs — consistent with a maturing, if not yet reversing, business cycle.
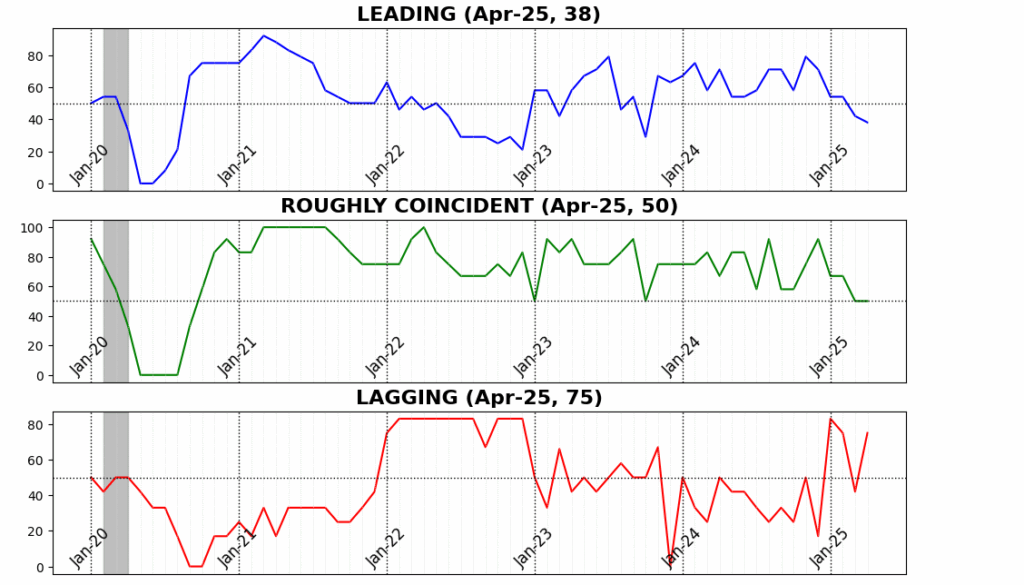
The trajectory of the AIER Business Conditions indicators over the past year tells a clear story of fading momentum and increasing economic uncertainty. Following a relatively mixed first half of 2024, November and December saw a notable surge in both the Leading and Roughly Coincident Indicators — likely reflecting optimism around the presidential election outcome, with markets anticipating pro-growth or business-friendly policies under a returning Trump administration.
However, the sharp drop in the Lagging Indicator in December suggested that longer-term conditions, such as credit and cost structures, were already under pressure. After Trump’s inauguration in January 2025, the Leading Indicator declined again and has since continued its downward path, reaching just 38 in April — the lowest reading since late 2023. This steady erosion likely reflects mounting concern over the implications of the administration’s aggressive tariff posture, which by early April was being formally articulated but not yet broadly implemented. While the Lagging Indicator has rebounded (reflecting higher credit usage and other late-cycle dynamics), the broader pattern — of shrinking forward momentum, steady but unremarkable coincident activity, and an increasingly heavy reliance on back-end economic support — suggests that businesses and investors are growing wary of near-term risks. The honeymoon of post-election enthusiasm appears to have ended, and the economy is now bracing for the real-world impact of rising trade barriers and policy volatility.
DISCUSSION, May – June 2025
May’s inflation data paint a complex picture of offsetting pressures within the US economy. While both headline and core CPI readings came in surprisingly soft — despite the onset of Trump’s overbroad tariffs — underlying details suggest significant tariff pass-through in goods categories with high import exposure, particularly major household appliances and other durable goods. However, persistent deflation in categories like used cars, recreation services, and portfolio management fees helped offset upward pressure, highlighting fragile consumer sentiment and uneven demand. Producer prices tell a more concerning story: core goods in the PPI report show accelerating inflation, particularly in finished durable goods, suggesting that firms are absorbing input cost increases and experiencing margin compression. This divergence between PPI and CPI implies that inflationary pressures may be building beneath the surface, even if they’re not fully reaching consumers yet. Core PCE, the Fed’s preferred gauge, is expected to tick up modestly to a 2.6 percent year-over-year pace, supported by specific categories but restrained by disinflation in healthcare and travel. The Federal Reserve is likely to remain cautious, seeing early signs of tariff-related cost pressures but recognizing that consumer-side weakness continues to dampen broader inflation momentum. In sum, inflation remains subdued for now, but signs of underlying firm-level cost strain and asymmetric pass-through suggest the disinflationary trend could prove fragile in the months ahead.
US manufacturing and services sectors both showed signs of stress in May, reinforcing the picture of a fragile, uneven expansion described in the latest inflation data. The ISM Manufacturing Index slipped further into contraction at 48.5, as firms reported softening demand, tariff-related uncertainty, and significant declines in both imports and exports — with the former plunging to a 16-year low. Inventory drawdowns and lengthening supplier delivery times suggest disarray in supply chains, while order backlogs continued to shrink. Industry comments reflected frustration over chaotic trade policy and its impact on pricing, profitability, and investment plans. Meanwhile, the ISM Services Index fell to 49.9 — its first contraction since 2022 — driven by a steep drop in new orders and delayed purchasing decisions amid federal budget cuts and tariff policy confusion. Although prices paid by service providers jumped to their highest since 2022, respondents noted that much of the burden was being absorbed via profit margins rather than passed on to consumers. Taken together, the data show that even as headline inflation remains muted, business sentiment and forward-looking demand indicators across both manufacturing and services are deteriorating under the weight of persistent policy uncertainty and cost pressures — raising the risk that corporate strain, rather than consumer weakness, may be the next stage of this economic slowdown.
Labor market conditions in May suggest a slow-burn deterioration beneath a still-stable surface. Headline nonfarm payrolls rose by 139,000 — modestly above expectations — but downward revisions to previous months and a flat unemployment rate of 4.2 percent conceal deeper fragilities. ADP’s private payroll data showed only 37,000 jobs added, the weakest in two years, with business services, education, and manufacturing shedding workers. Sectors most exposed to tariffs — like transportation and manufacturing — continued to underperform, while job losses in temporary help and federal employment signal growing caution. Hiring is clearly slowing, but employers are not yet engaging in mass layoffs — what some economists describe as a “low-hiring, low-firing” equilibrium. The labor force shrank by over 600,000 in May, and long-term unemployment as a share of total joblessness remains elevated at over 20 percent, despite a superficial decline. Meanwhile, wage growth — at 3.9 percent year-over-year — remains resilient, reflecting firms’ reluctance to shed workers despite cost and demand uncertainty.
A deeper look into the labor dynamics shows a cooling jobs market marked by growing mismatches and rising structural challenges. The job-finding rate continues to fall, as does the quits rate, suggesting that workers are both less able to find new jobs and less willing to risk leaving current positions. The U-6 broader unemployment rate, which includes discouraged and underemployed workers, held steady at 7.8 percent, reinforcing that headline numbers understate slack. Professional and business services employment — a proxy for white-collar sectors — remains stagnant, while job creation is concentrated in health care and construction, intensifying a bifurcation in labor opportunities. Many jobseekers, especially in high-skill sectors, face prolonged job hunts or underemployment. Despite President Trump’s tariff pause on some goods and continued pressure on Fed Chair Powell to cut rates, hiring hesitance driven by tariff unpredictability, shrinking public sector employment, and sectoral divergences suggests a labor market losing traction. Overall, while the surface data supports a narrative of resilience, the underlying indicators reveal mounting strain — with the economy precariously balancing between stagnation and slippage.
Consumer and business sentiment both showed meaningful improvements in recent weeks, but the rebound remains fragile and heavily contingent on policy clarity. The University of Michigan’s consumer sentiment index jumped 8.3 points in June — the largest gain in 17 months — as inflation expectations eased sharply, especially for the one-year horizon, which fell from 6.6 percent to 5.1 percent. Consumers also reported the strongest improvement in personal finance expectations in over three years, suggesting a tentative stabilization after weeks of volatility tied to President Trump’s sweeping tariff hikes. However, views on overall business conditions and buying climates remain subdued relative to late 2024, reflecting lingering anxiety. Meanwhile, the NFIB’s Small Business Optimism Index rose 3.0 points to 98.8 in May, led by improved expectations for sales and business conditions. Capital spending plans and anticipated price hikes both increased, signaling confidence in demand, yet an elevated uncertainty index and falling earnings trends point to unresolved concerns about input costs and federal policy unpredictability — including the delayed tax and spending bill touted as a boost for small enterprises.
Together, the sentiment readings illustrate a US economy at a psychological inflection point: a population cautiously hopeful about the future, yet clearly reactive to unpredictable federal actions. Both households and small firms are responding positively to a pause in tariff escalation and signs of fiscal support on the horizon, but they remain vulnerable to any renewed policy shocks. Importantly, the improved consumer outlook may help sustain spending in the near term, even as business hiring and investment stay subdued. Still, elevated uncertainty metrics in both surveys suggest that optimism is conditional rather than durable. For economic growth to reaccelerate meaningfully, more than temporary relief is needed — clarity on trade, inflation containment, and a credible fiscal path would be necessary to convert tentative optimism into sustained expansion.
Retail sales declined for a second consecutive month in May, dropping 0.9 percent — the steepest fall since early 2025 — as consumers reacted to tariff-driven price uncertainty and tighter household finances. The pullback was concentrated in autos, building materials, and gasoline, suggesting an end to front-loaded purchases made ahead of expected tariff hikes. Broader indicators of demand, including a drop in industrial production and the lowest homebuilder sentiment since 2022, reinforced signs of consumer caution. However, control-group sales — which feed into GDP calculations — rose 0.4 percent, offering a silver lining and suggesting underlying consumption remains resilient. While large retailers note that shoppers are still coming in, they’re becoming more selective, focusing on essentials and scaling back discretionary purchases. The data reflect a bifurcation: higher-income consumers are holding up well, while middle- and lower-income households are adjusting behavior amid ongoing economic anxiety. The mixed report highlights a fragile consumption landscape that, while not collapsing, is increasingly shaped by volatility in prices, policy, and sentiment.
Further back in the term structure from consumer goods, US manufacturing and industrial output data reveal a murky picture of a sector straining under uneven policy signals and rising input costs. Factory production declined 0.4 percent in April and industrial production dipped another 0.2 percent in May, weighed down by weaker output in consumer goods, nondurables, and utilities. While auto and aerospace manufacturing provided isolated strength — likely a front-loaded response to tariff threats — broader industrial activity remains subdued, with capacity utilization falling to 77.4 percent. Production of business equipment eked out gains, but nondurable goods output declined despite an uptick in aggregate hours worked, suggesting productivity shortfalls. The three-month decline in consumer goods output reflects not just softening demand but lingering uncertainty that has stalled capital expenditure plans and dragged on factory sentiment indices. Surveys like the ISM remain in contraction territory, reinforcing anecdotal evidence that firms are delaying hiring and investment decisions until tariff paths and fiscal measures become clearer. The sector’s volatility and conflicting signals illustrate a fragile manufacturing base more reactive than resilient — one that could struggle to recover momentum without decisive and coherent trade and tax policy from Washington.
The Federal Reserve continues to tread cautiously, holding interest rates steady for a fourth consecutive meeting while signaling both a softer labor market and persistent inflation risks. Although the median forecast still implies 50 basis points of rate cuts in 2025, the distribution of views within the FOMC has widened considerably, with nearly equal weight behind either no cuts or two. Revised economic projections reflect a slower return to the neutral rate, with core PCE inflation expectations rising modestly through 2027 and unemployment estimates nudging higher. Chair Jerome Powell struck a more hawkish tone during his press conference, emphasizing tariff-related inflation pressures and the resilience of employment data. Despite this, market participants interpreted the median rate path as modestly dovish, pricing in a slight increase in expected easing. The overall picture is one of growing uncertainty, with internal divisions on the FOMC mirroring broader volatility in the economic data. The Fed remains on hold, awaiting greater clarity on the cumulative effects of tariffs, consumer price pass-through, and labor market dynamics.
Meanwhile, fiscal policy is increasingly defined by partisan urgency and legislative congestion, with three concurrent budgetary battles underway. The centerpiece is the GOP’s reconciliation package—a sweeping tax cut extension and spending bill with a ten-year, $2.4 trillion debt impact, facing internal Republican friction over Medicaid cuts and green subsidies. Additional efforts include a more modest rescission plan targeting $9.4 billion in discretionary cuts, and the annual appropriations process, which risks a government shutdown if no agreement is reached by September 30. Democrats are largely sidelined from reconciliation, but are preparing to leverage the bill’s political liabilities—such as expanded uninsured ranks and massive deficits—heading into 2026. Adding complexity is the administration’s assumption that high tariff revenues will offset lost tax income, a scenario dependent on uncertain long-term trade policy. In tandem, the monetary and fiscal landscapes reveal a fractured policy environment: monetary easing remains tentative, while fiscal expansion barrels forward with limited bipartisan consensus. The combined effect may prove pro-cyclical at the wrong moment—stimulative fiscal policy colliding with a Fed reluctant to declare victory over inflation.
The present economic outlook is being expressed through soft surface data sitting atop solidifying structural strains. Inflation readings remain subdued on the consumer side, yet firm-level data show rising producer prices and margin compression, hinting at suppressed cost pressures with an unclear timing of impending tariff pass-throughs. Manufacturing and services activity continue to contract, with supply chain dysfunction and trade policy uncertainty weighing on investment and hiring. Labor market indicators present a stable façade, but reveal a deeper deterioration in participation, job-finding, and sectoral balance — particularly in tariff-sensitive industries. Consumer and business sentiment have improved modestly, but remain fragile, highly dependent on policy stability, and uneven across income levels. Fiscal policy, meanwhile, is charging ahead with expansive tax cuts and spending proposals, while monetary policy stays cautious, its easing path clouded by internal FOMC divisions and ongoing inflationary risk. Together, this produces a policy collision course where stimulative fiscal actions may amplify the very inflationary dynamics the Fed seeks to restrain.
In sum, the US economy is balancing on a narrowing ledge: demand remains intact but increasingly selective, sentiment is conditionally optimistic, and hiring continues at a slowing pace in an increasingly bifurcated labor market. With core PCE likely to tick higher and industrial data showing signs of stagnation, the real economy is absorbing more stress than headline indicators suggest. A clearer outlook depends on answers to several pressing questions: Will tariff-related cost pressures pass through more forcefully to consumers this fall? Can fiscal stimulus offset deteriorating business investment without overheating demand? And how credible is the current path of policy restraint if labor market slack re-emerges?
Until these uncertainties resolve, the US economy remains singularly vulnerable to asymmetric shocks: a system stabilizing for now, but dependent on coherence between Washington’s fiscal ambitions and the Fed’s inflation-fighting resolve.
LEADING INDICATORS

ROUGHLY COINCIDENT INDICATORS
LAGGING INDICATORS

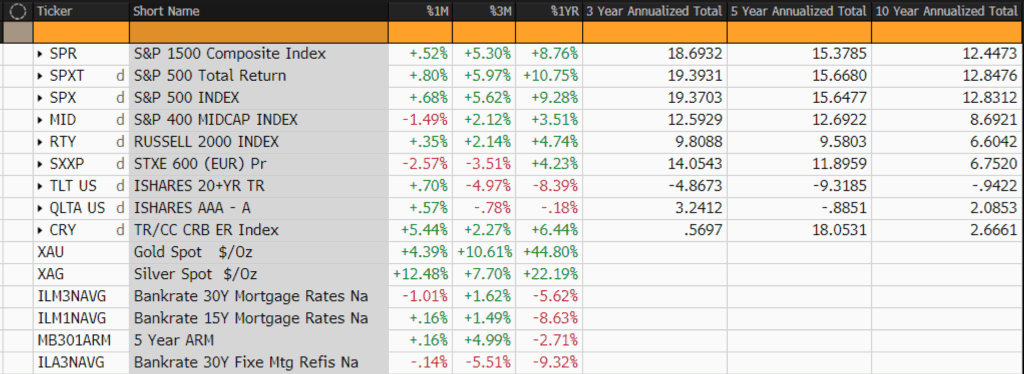
CAPITAL MARKET PERFORMANCE