

What do the following three dates have in common with each other?
1975.
January 1, 1994.
December 11, 2001.
Think for a moment.
Give up?
Each of those three dates is one protectionists routinely identify — either explicitly or by implication — as marking a significant turn for the worse in Americans’ economic fortunes due to international trade.
1975 is the last year in which America ran an annual trade surplus. That year was the last to see the dollar value of Americans’ exports of goods and services exceed the dollar value of Americans’ imports of goods and services. Every year since then — 2025 is on track to be the fiftieth — the United States has run annual trade deficits.
January 1, 1994, is the date that the North American Free Trade Agreement (NAFTA) took effect. Despite some minor modifications and a name change (to United States-Mexico-Canada Agreement, or USMCA) in 2020, this trade agreement remained in effect until just a few weeks ago when Pres. Trump unilaterally moved the US into violation of it.
December 11, 2001, is the date on which China gained membership in the World Trade Organization (WTO), thus further increasing that country’s trade with many other countries, including the US.
If you pay attention to pronouncements, discussions, and debates in the US over trade you’ll regularly encounter laments about America’s “chronic trade deficits” (implying that new economic troubles began as 1975 ended), complaints about the depredations visited on Americans by NAFTA (suggesting that Americans’ economic fortunes began to worsen as 1994 dawned), and, of course, dire warnings of the alleged economic dangers that we Americans encounter by trading with the Chinese (implying that America’s economic health only took another turn for the worse as 2001 was coming to a close).
Fortunately, a great deal of relatively straightforward economic data allows us to put these common claims to the test. As is true of any economic data — which, after all, are drawn from an incredibly complex, dynamic, and ever-changing real-world economy — the data that I present below are incapable of proving anything.
Counterfactuals can always be offered, and questions about classifications, excluded variables, missing data, measurement methods, and errors, are never off the table. Nevertheless, even imperfect data can be sufficiently accurate to be revealing. At any rate, when used honestly such data are often an important part — although never the exclusive part — of any sound analysis or argument about economic policy.
So here are six economic phenomena the trends in which are useful to consult to test the claims about trade described above:
- workers’ real earnings
- US industrial production
- US industrial capacity
- US capital stock
- US manufacturing employment as a share of total employment
- inflation-adjusted average household net worth
These six phenomena by no means exhaust the potential data that are useful for judging the debate between protectionists and free traders, but they’re a good start.
Workers’ Real Earnings
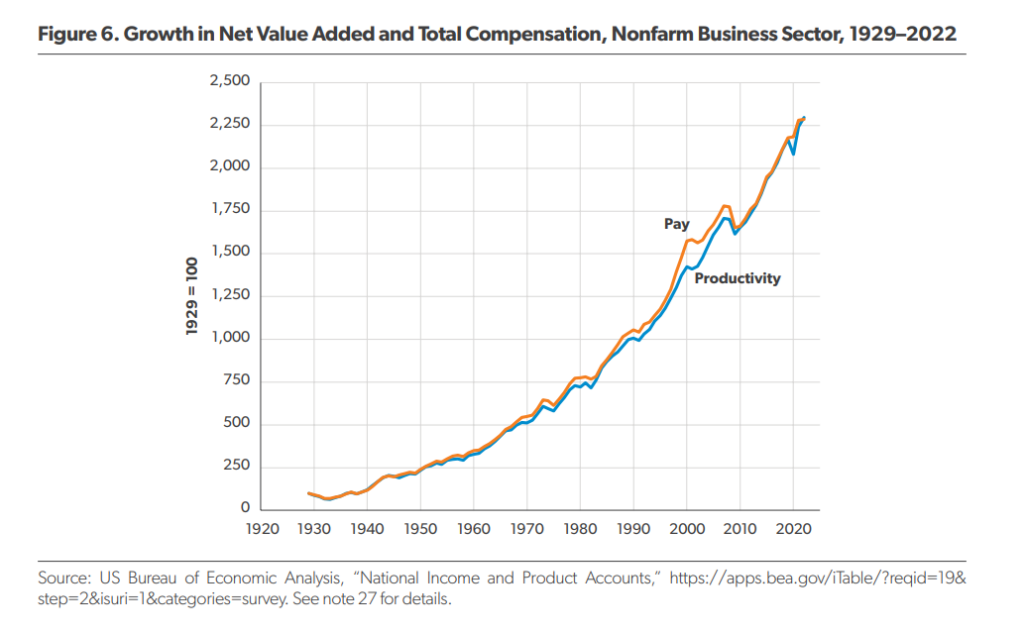
Among the most meticulous and informed scholars who research economic trends is the American Enterprise Institute’s Scott Winship. His 2024 study Understanding Trends in Worker Pay over the Past 50 Years (PDF) is well worth a full and careful read. Among other achievements, it reveals the many sloppy uses of statistics by pundits who argue that ordinary Americans are today no better off economically than were ordinary Americans when the White House was occupied by Gerald Ford. But for our purposes, what Winship shows in his Figure 6 suffices: Today, average inflation-adjusted total compensation (wages and fringe benefits) for workers in the nonfarm business sector is about 250 percent higher than it was in 1975, 100 percent higher than in the year NAFTA took effect (1994), and about 40 percent higher than when China joined the WTO (2001).
US Industrial Production
US industrial production is today (February 2025) at an all-time high. Its previous all-time high was in September 2018, after which it leveled off — perhaps due to Trump’s first round of tariffs — and then fell (of course) during COVID. From the end of COVID until now it’s been largely flat and just below its September 2018 level until finally eking out a new all-time high in February of this year.
One plausible culprit for this leveling-off is the barrage of tariffs that began in early-to-mid-2018 and were mostly retained during the Biden years. Because more than half of American imports are inputs used in domestic production, these trade restrictions dampen the productivity of American producers.
Contrary to claims too numerous to count, the American economy has not been deindustrialized. Americans today (January 2025) produce 153 percent more industrial output than in 1975, 55 percent more than in January 1994, and 18 percent more than in December 2001.
US Industrial Capacity
Nor has the American economy’s capacity to produce industrial output been, as is often asserted, “hollowed out.” America today has an industrial capacity that is 146 percent larger than it was in 1975, 64 percent larger than in January 1994, and 12 percent larger than in December 2001. This reality is especially notable given that as we Americans grow richer, we spend more on services relative to what we spend on goods.
US Capital Stock
In 2019 (the last year for which these data are available), the inflation-adjusted size of the US capital stock was 178 percent larger than it was in 1975, 66 percent larger than in 1994, and 36 percent larger than in 2001.
US Manufacturing Employment as a Share of Total Nonfarm Employment
The accompanying graph shows, from January 1939 through February 2025, manufacturing employment as a share of total nonfarm employment in the US.
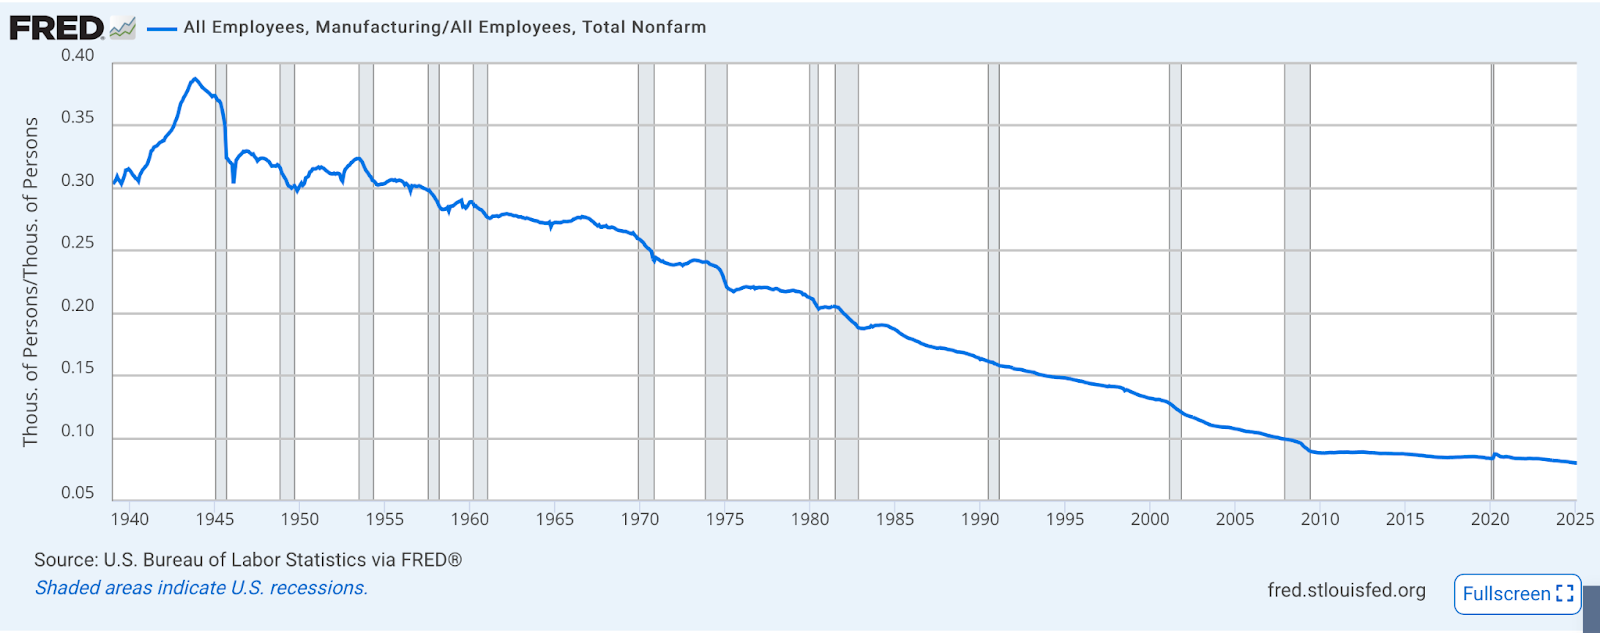
I constructed this graph from two different data sources available at the St. Louis Fed’s FRED data site. As you can see, protectionists are correct when they note that manufacturing employment as a share of total employment has fallen since 1975, has continued to fall since 1994, and has fallen further still since 2001. But as you can also see, this trend dates back long before 1975. Excluding the wartime (November 1943) peak, manufacturing workers as a share of all nonfarm workers started falling rather steadily in 1954, 22 years before America began its still-unbroken run of annual trade deficits, 40 years before NAFTA, and 47 years before the WTO accepted China as a member.
It’s true that the average monthly rate of decline in the share of workers employed in manufacturing has been very slightly faster from 1976 through today (February 2025), at 0.171 percent, than it was from 1954 through 1975, at 0.134 percent. But it’s also true that the average monthly rate of decline in the share of manufacturing workers has slowed since China joined the WTO. From January 1976 through November 2001, the share of manufacturing workers fell at an average monthly rate of 0.192 percent; from December 2001 through February 2025, that rate dropped to 0.146 percent.
Manufacturing employment as a share of total employment is falling not because of trade but because of improvements in labor-saving technologies, combined with Americans’ rising demand for services relative to the demand for goods.
Inflation-adjusted Average Household Net Worth
If protectionists are correct that US trade deficits either push Americans further into debt to foreigners or result from Americans selling too many assets to foreigners, the net worth of American households would have fallen over the past half-century, as these years saw an unbroken string of annual US trade deficits. But the opposite has happened. As I explain in this short blog post at Café Hayek, the average inflation-adjusted net worth of a US household today (2024) is 232 percent higher than it was in 1975, 140 percent higher than in 1994, and 78 percent higher than in 2001. In short, we Americans have gotten richer as we’ve run trade deficits and since NAFTA took effect as well as since China joined the WTO.
Again, none of these six trends in the data proves that protectionists are mistaken to argue that freer trade and trade deficits have harmed America economically. But taken together they should at least put the burden of proof squarely and heavily where it belongs — namely, on protectionists. It is they, and not free traders, who advocate government-imposed restrictions on Americans’ economic liberties.